Smaller strikes also in decline
Several readers responded to the recent post on strikes by asking if the BLS stats, which cover stoppages involving 1,000 or more workers, are missing smaller-scale actions. (And I should say that I’m being imprecise by calling all stoppages “strikes,” since the figures also include lockouts.) Alas, no.
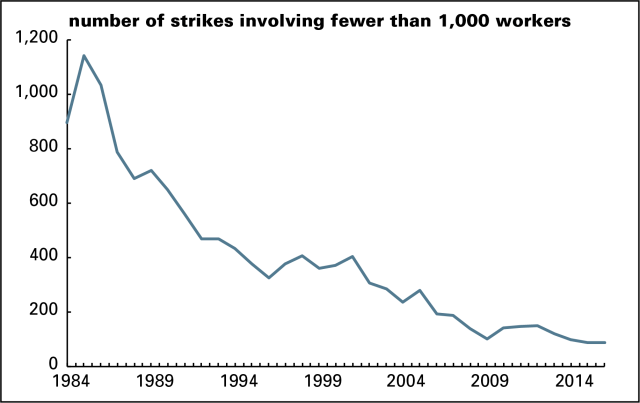
The Federal Mediation and Conciliation Service publishes data on all work stoppages, regardless of the number of workers involved. The numbers from 1984 through 2016 are graphed below.
Smaller strikes peaked at 1,142 in 1985, which looks big by recent standards. If the trajectory is anything like larger strikes, then 1985 was probably a major comedown from the 1950s through the 1970s; the average that year was down 82% from the 1950–1979 average. Even so, 2016’s total of 88 was down 92% from 31 years earlier.
The 2017 data runs only through the third quarter. There were only 39 strikes in the first months of the last year; if you annualize that, you get 52 strikes, 41% fewer than 2016, and 97% fewer than in 1985.
If you look at days of “idleness,” as they say, the decline is even starker: 93% from the 1984 peak (yes, different peak year, and not a typo for “1985”). If you annualize the days of idleness for 2017, you get a 99% decline.
So there’s not much striking going on under the radar either.

