Americans staying put
There are certain things that people say that sound so true that others repeat them credulously without feeling the need to cite evidence. Two covid-era favorites: everybody’s working from home (WFH). And people have decamped en masse for the hinterlands, thanks to WFH. Neither is really true.
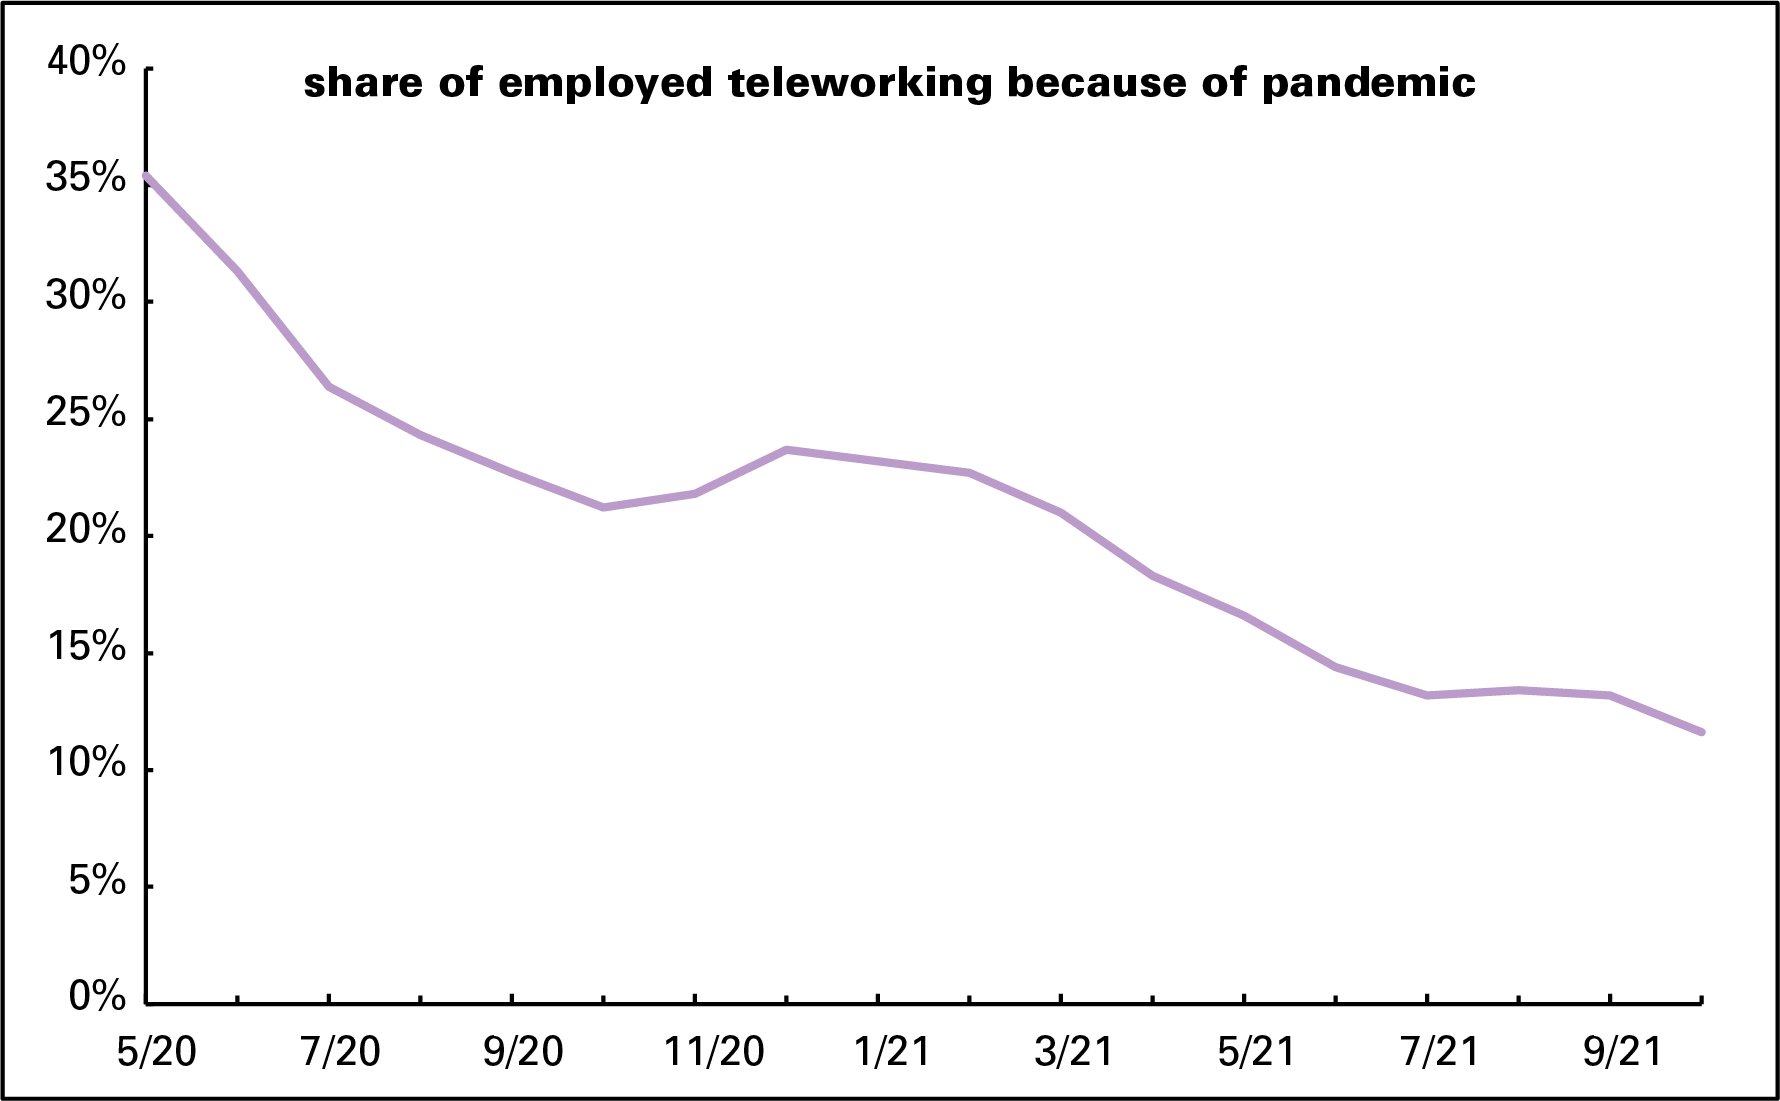
I wrote about the slim WFH numbers in September. In July, which was the most recent month available then, 13.2% of the employed were teleworking, the Bureau of Labor Statistics’ favored term. In October, that had fallen to 11.6% (graph below). Their ranks were still dominated by highly credentialed professional and managerial workers. The miserably paid couriers who brought (and still bring) them food and other essentials were most certainly not working from home, though they easily fall out of some people’s conception of “everybody.”
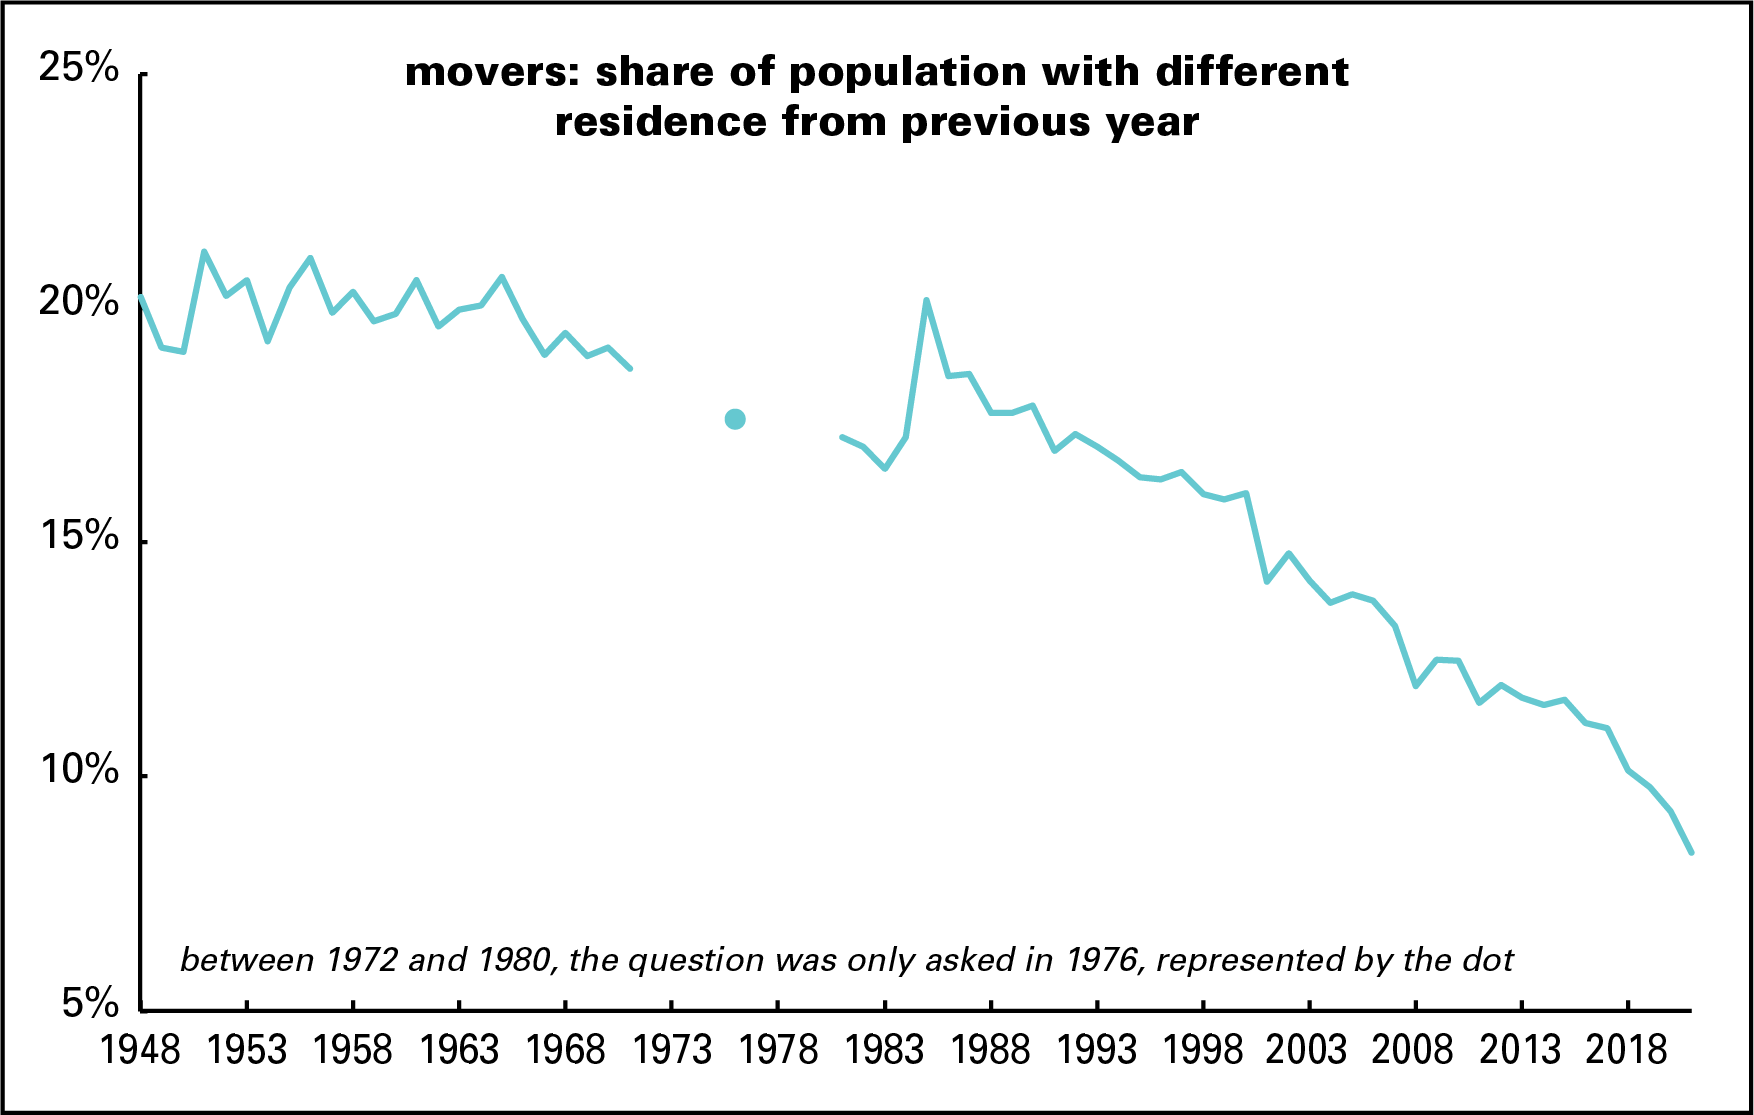
Even if “everybody” wasn’t teleworking, lots were. But there’s no support at all for the mass decampment story. Freshly released data from the Census Bureau shows just 8.4% of Americans moved between 2020 and 2021, the smallest share since the Bureau started counting in 1948. That was down almost a full percentage point from the previous pair of years, a large decline by recent historical standards. But as the graph below shows, the share has been declining steadily since 1985’s 20.2%, when high oil prices and deindustrialization drove movers south and west in search of jobs. (Unfortunately for the energy migrants, oil prices collapsed in 1986.)
Also not surviving a confrontation with Census data: the claim that, freed from the need to go to an office, covid refugees headed for the hills (and beaches) in large numbers. They didn’t, as the next graph shows.

Yes, people have been moving out of cities for decades, but the net out-migration of 0.5% of the national population was smaller than the two previous years, and over a quarter less than the 1986–1999 average. (Reminder: these numbers count only in- and out-migration, not changes in population levels, which are also affected by births and deaths.) As the trendline shows, urban out-migration has been in a slowing trend since this data series began. Suburbs gained migrants, but at a rate slightly lower than the previous eight years. Metro areas—the combination of suburban areas and the “principal” cities associated with them— have seen steady, if declining, in-migration for all of the last 35 years. And nonmetro areas, supposedly the recipients of all those terrified urban refugees, lost migrants between 2020 and 2021—more, in fact, than any year since 2014.* That trendline ambles very lazily downward, though it’s hard to distinguish from the axis, because it’s so close to 0.
A larger question here, pandemic aside, is what happened to American mobility? Pulling up stakes and moving a long distance in search of fresh opportunity used to be a foundational national myth. Like many others, it needs to be retired.
* The Census Bureau reminds us that nonmetropolian areas are not the same as “rural” areas, since there are many rural-feeling regions that are nonetheless technically part of metro areas. Census has a point, but on the other hand, there are social differences between thinly populated areas that are close to major conurbations and those that aren’t. For example, parts of Westchester County, just north of New York City, may look rural, but it’s amenity-plentiful rich people’s country, and a short train ride away from the big city.

