Union density keeps falling
As it has for thirty-seven of the last fifty years, the share of the workforce belonging to a union, aka union density, fell in 2022. It’s risen in only four years in that span; it was unchanged in nine. The grim history, reported this morning by the Bureau of Labor Statistics, is graphed below.
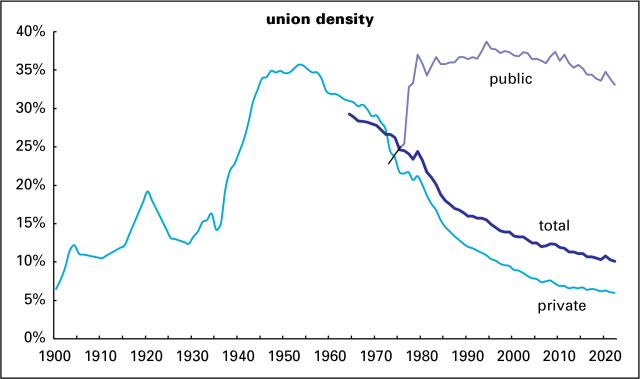
In 2022, 10.1% of the employed belonged to a union, down from 10.3% the previous year. The decline was led by the public sector, where density fell from 33.9% to 33.1%, a decline of 0.8; the private sector was down a mere 0.1, to 6.0% (an all-time low in a history going back to 1900).
As the graph shows, private sector density has been in a long decline from its 1951 (!) peak of 34.7%. Public sector unions had a good run from 1973 to 1994, when they peaked at 38.7%. But public sector density drifted lower over the next decade and a half, a decline that accelerated markedly after then-Wisconsin governor Scott Walker launched his war on public sector unions in 2011.
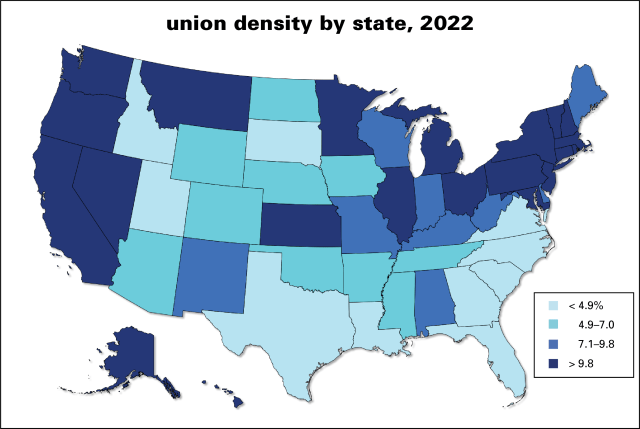
Unionization rates vary widely by state, from over 20% in Hawaii and New York to under 3% in North and South Carolina. The graph below breaks the 2022 density numbers into quartiles. Note that the highest rates are in the Northeast, upper Midwest, and on the Pacific Coast; the lowest are in the South, particularly the old Confederacy. The unweighted average of the former Confederate states is 4.4%; for the non-Confederate states, 10.8%.
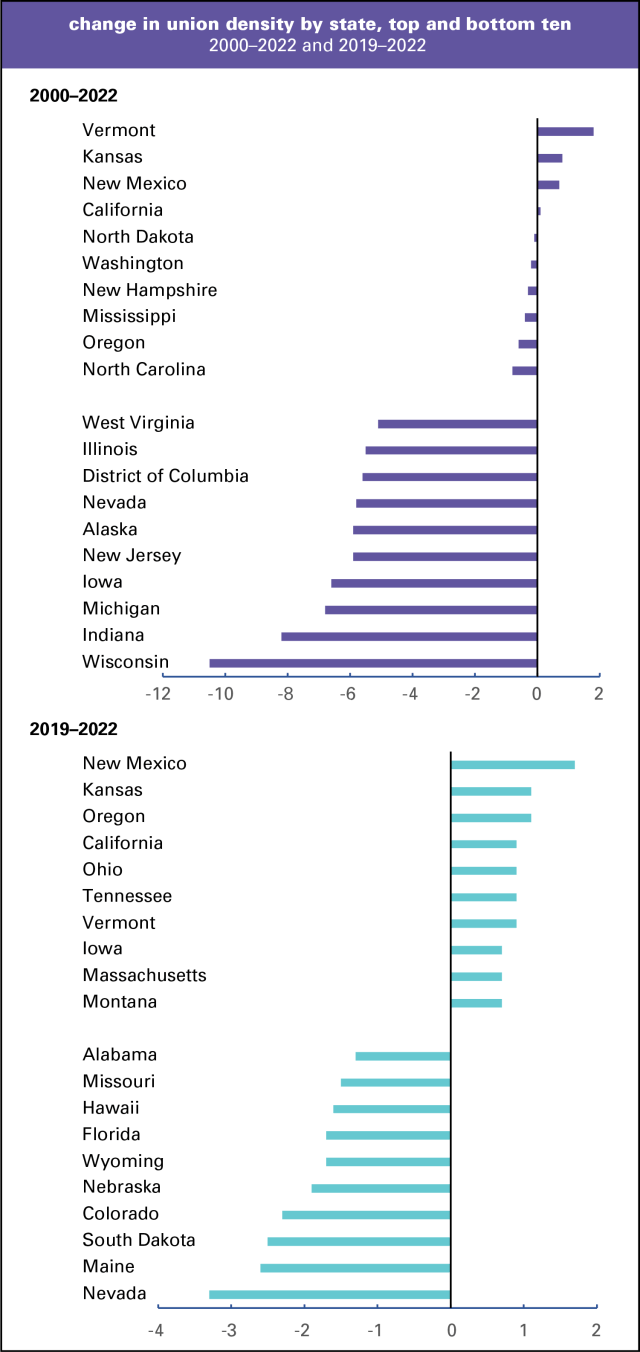
Variations aside, most states have seen declines since 2019 (33, counting DC as a state) and almost all have since 2000 (47 of them). Here are graphs of the top and bottom ten over each period.
Many books have been written explaining the reasons behind this dismal history, and while this is no place to go into detail, I’ll list a few prominent reasons: the relentless hostility of employers (going back to the 19th century, when Pinkertons were hired to shoot strikers), extremely union-unfriendly labor law, and a pervasive consciousness of self-reliance among the masses—though unions have been polling very well lately, with 71% of those surveyed by Gallup approving, up from 48% in 2009, in the depths of the Great Recession. (Crises often don’t encourage militancy.) But the other obstacles, employer hostility and a miserable legal environment, make it very hard to translate approval into actual union membership.
I’ll have more to say in the coming days, but for now I’ll conclude this the same way I have for the last several years:
There are a lot of things wrong with American unions. Most organize poorly, if at all. Politically they function mainly as ATMs and free labor pools for the Democratic party without getting much in return. But there’s no way to end the 40-year war on the US working class without getting union membership up.
Note on sources: The public sector data for 1973–1999 comes from Barry Hirsch and David Macpherson. Private sector data for 1900–1964 comes from Leo Troy and David Sheflin’s Union Sourcebook. Later data is from the BLS.

