
Fresh audio product
Just added to my radio archive (click on date for link):
January 27, 2022 Peter Goodman, author of Davos Man, on plutocrats and their pretensions • Vijay Prashad, director of The Tricontinental, outlines a plan to save the world, essentially from Davos Man
Union membership resumes its fall
Union membership fell by almost 2% in 2021 as employment rose by over 3%. That took union density—the share of the workforce belonging to unions—down from 10.8% in 2020 to 10.3% last year, where it was in 2019. Density rose in 2020 because more nonunion workers lost their jobs in the covid crisis than their unionized counterparts, but 2021’s return to employment undid that.
For the private sector, just 6.1% of workers were unionized last year, down from 6.3% in 2020, an all-time low for a series that goes back to 1900. (Official numbers from the Bureau of Labor Statistics began in 1983; I’ve assembled figures for earlier years from various sources.) Public sector density also fell, from 34.8% to 33.9%, not quite a record low. But the number of government workers organized in unions fell by 2.7%, almost four times as much as private sector members. The full history is graphed below.

Motion pictures and sound recording (17.3% unionized), transportation and utilities (15.4%), private education (12.9%), and construction (12.6%) are the most heavily organized industries. Towards the bottom of the list are retail (4.4%), agriculture (2.9%), finance (2.3%), and food service and drinking places (1.2%). Aside from finance, the low-density industries are classically low-wage, and the weak union presence is a major reason why. Manufacturing, once a union powerhouse, is down to 7.7%—half 2000’s level (when the data begins). And over that period, the hourly wage in manufacturing has gone from being 3% above the overall average to 9% below.
As the map below shows, density varies widely by state. At the bottom are South Carolina (1.7%) and North Carolina (2.6%); at the top, Hawaii (22.4%) and New York (22.2%). The eleven original states of the Confederacy (Alabama, Arkansas, Florida, Georgia, Louisiana, Mississippi, North Carolina, South Carolina, Tennessee, Texas, and Virginia) have an average unionization rate of 4.4%, well under half the national average of 10.3%. Curiously, the Confederacy’s two latecomers, Kentucky and Missouri, come in much higher, an average of 8.1%, which takes the average for the full Confederate thirteen up to 4.9%. The average of the non-Confederate states is 11.2%. (These averages aren’t weighted by population.) The persistence of historical legacies is striking.
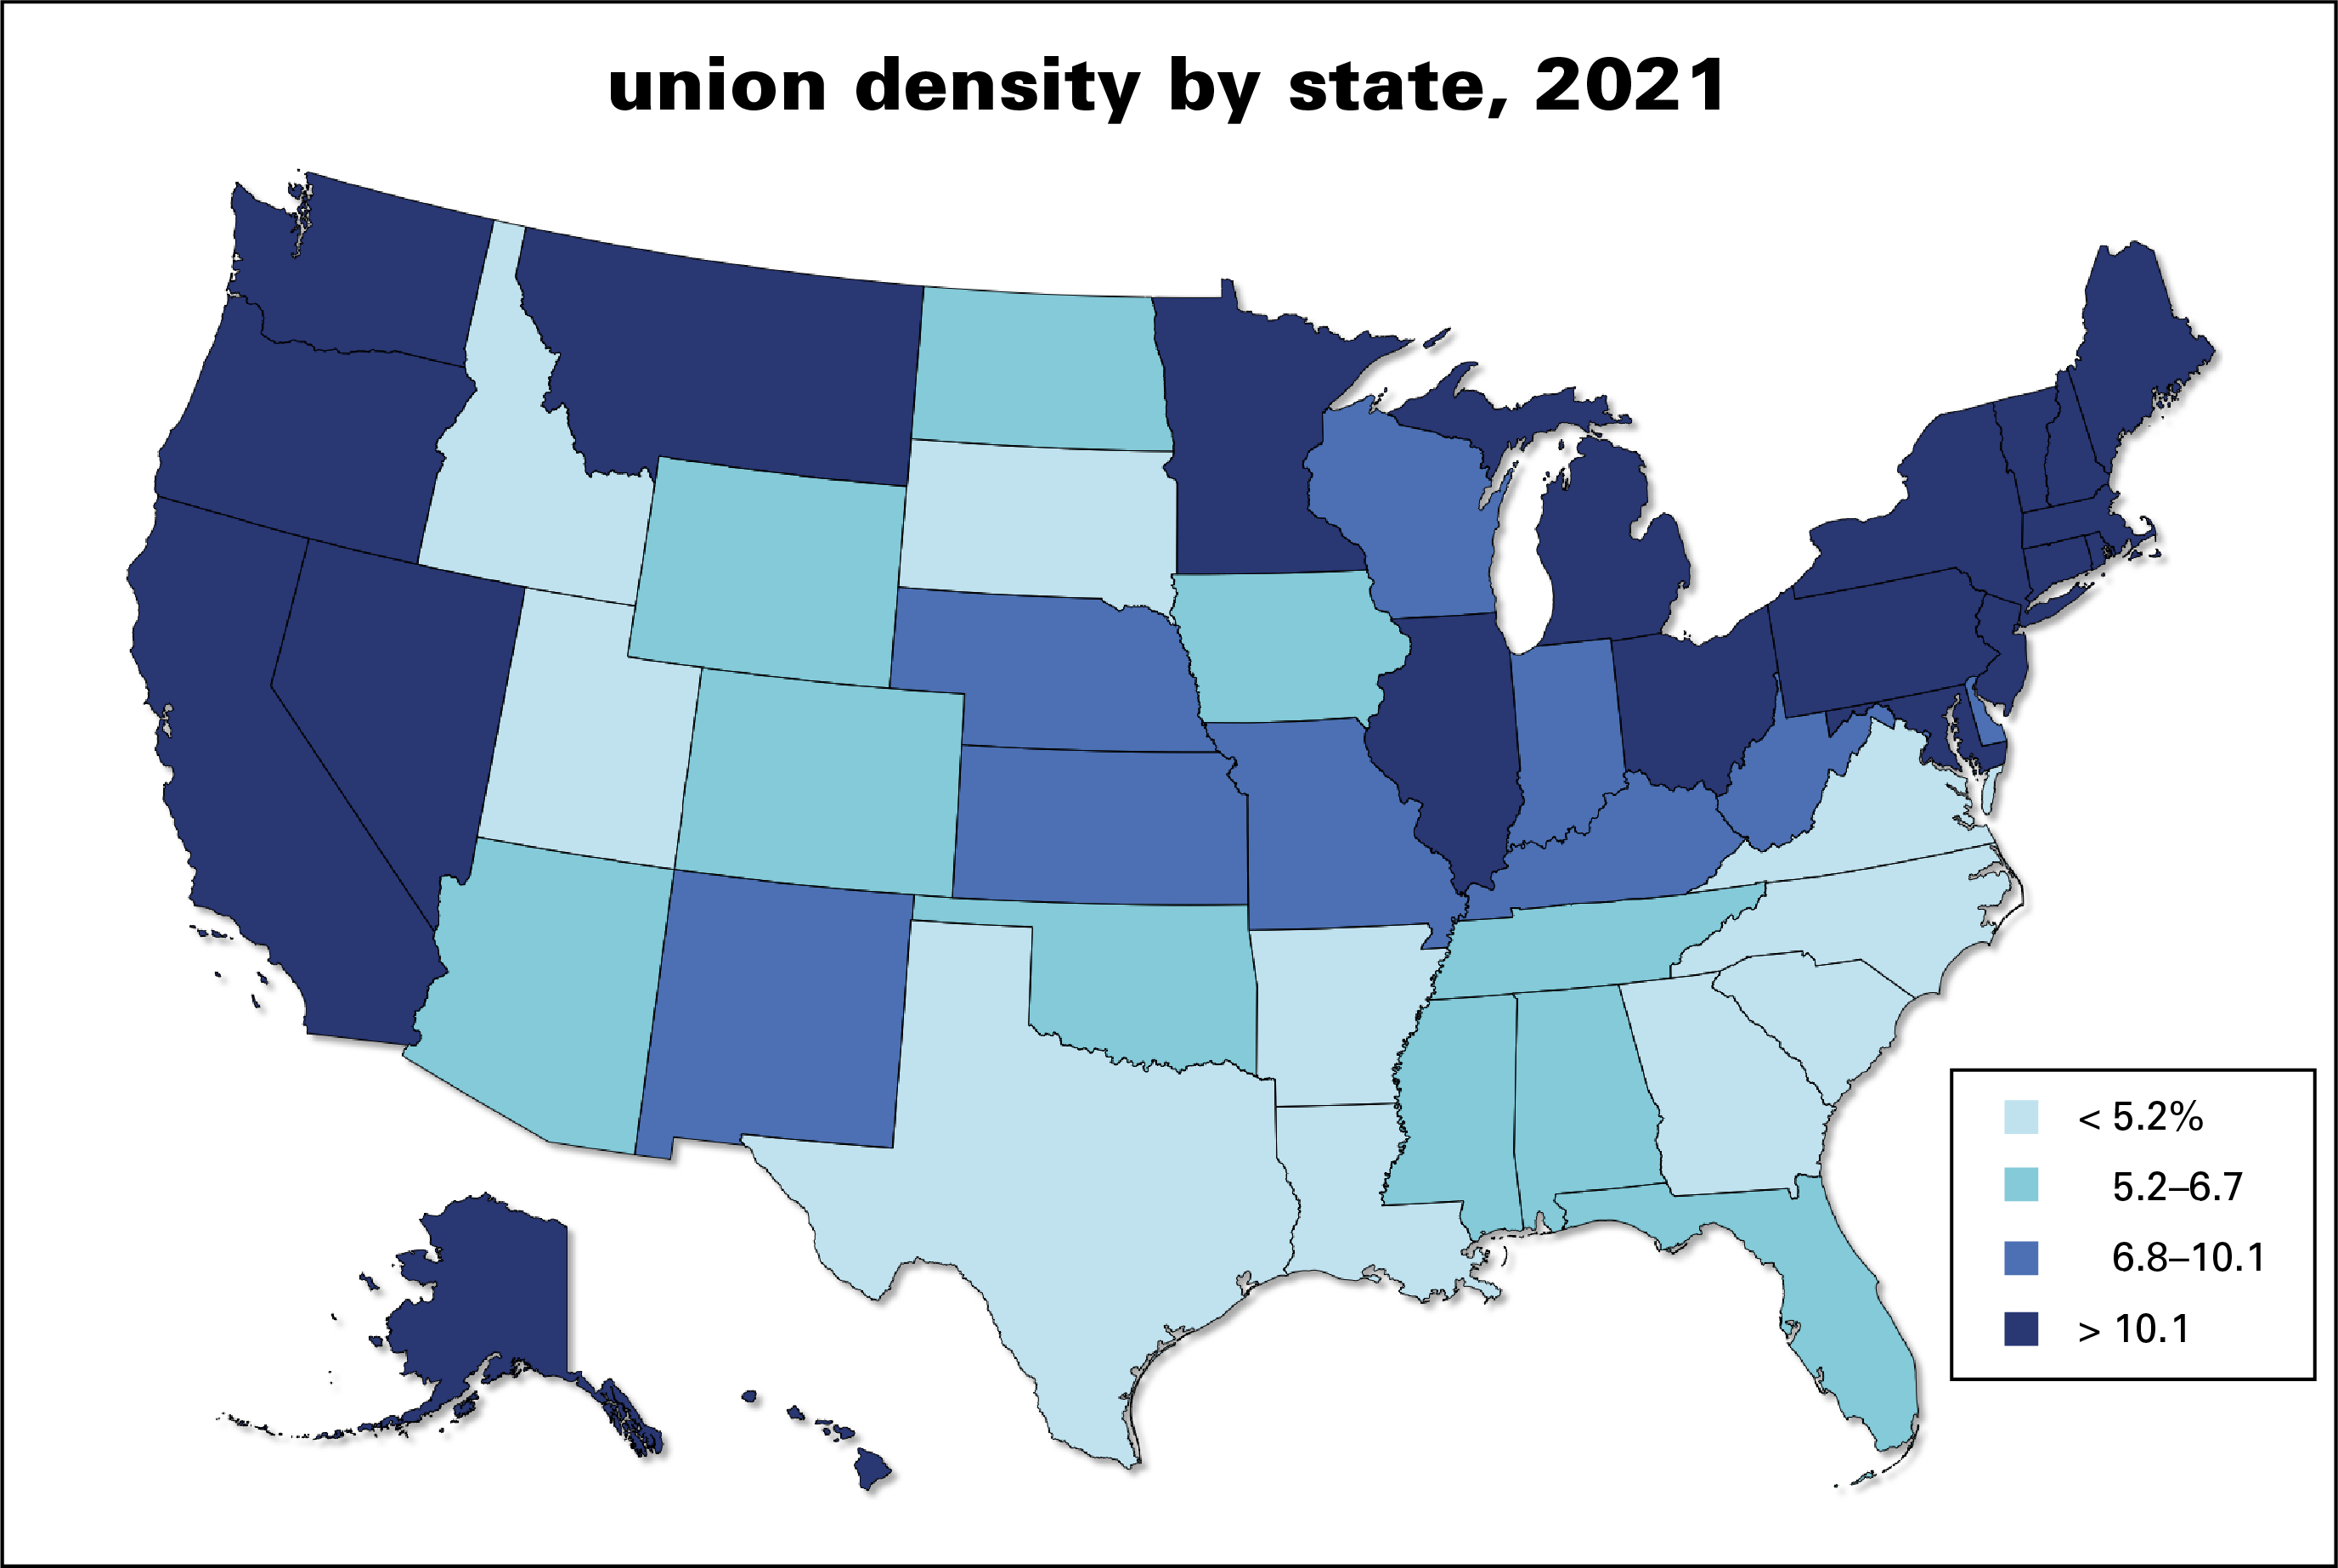
Since 2000, only four states have seen an increase of unionization, Vermont (up 2.0 percentage points), Oregon (+1.7), Washington (+0.8), and Kansas (+0.2). The rest, including DC, have all seen declines, led by Wisconsin, the home of former governor Scott Walker’s war on public-sector unions, down 9.7 since 2000, and Michigan, down 7.5. Seven states, mostly in the South and Midwest, declined by 5 points or more.
Why care? Unions raise wages and benefits and increase job security. For example, 95% of unionized workers in the private sector have access to health benefits, compared with 68% of nonunion workers; figures are similar for retirement benefits and sick leave. And the union wage premium is significant across industries, occupations, and demographics. Weekly earnings for unionized workers overall are 20% higher than nonunion for all workers, and 14% in the private sector.
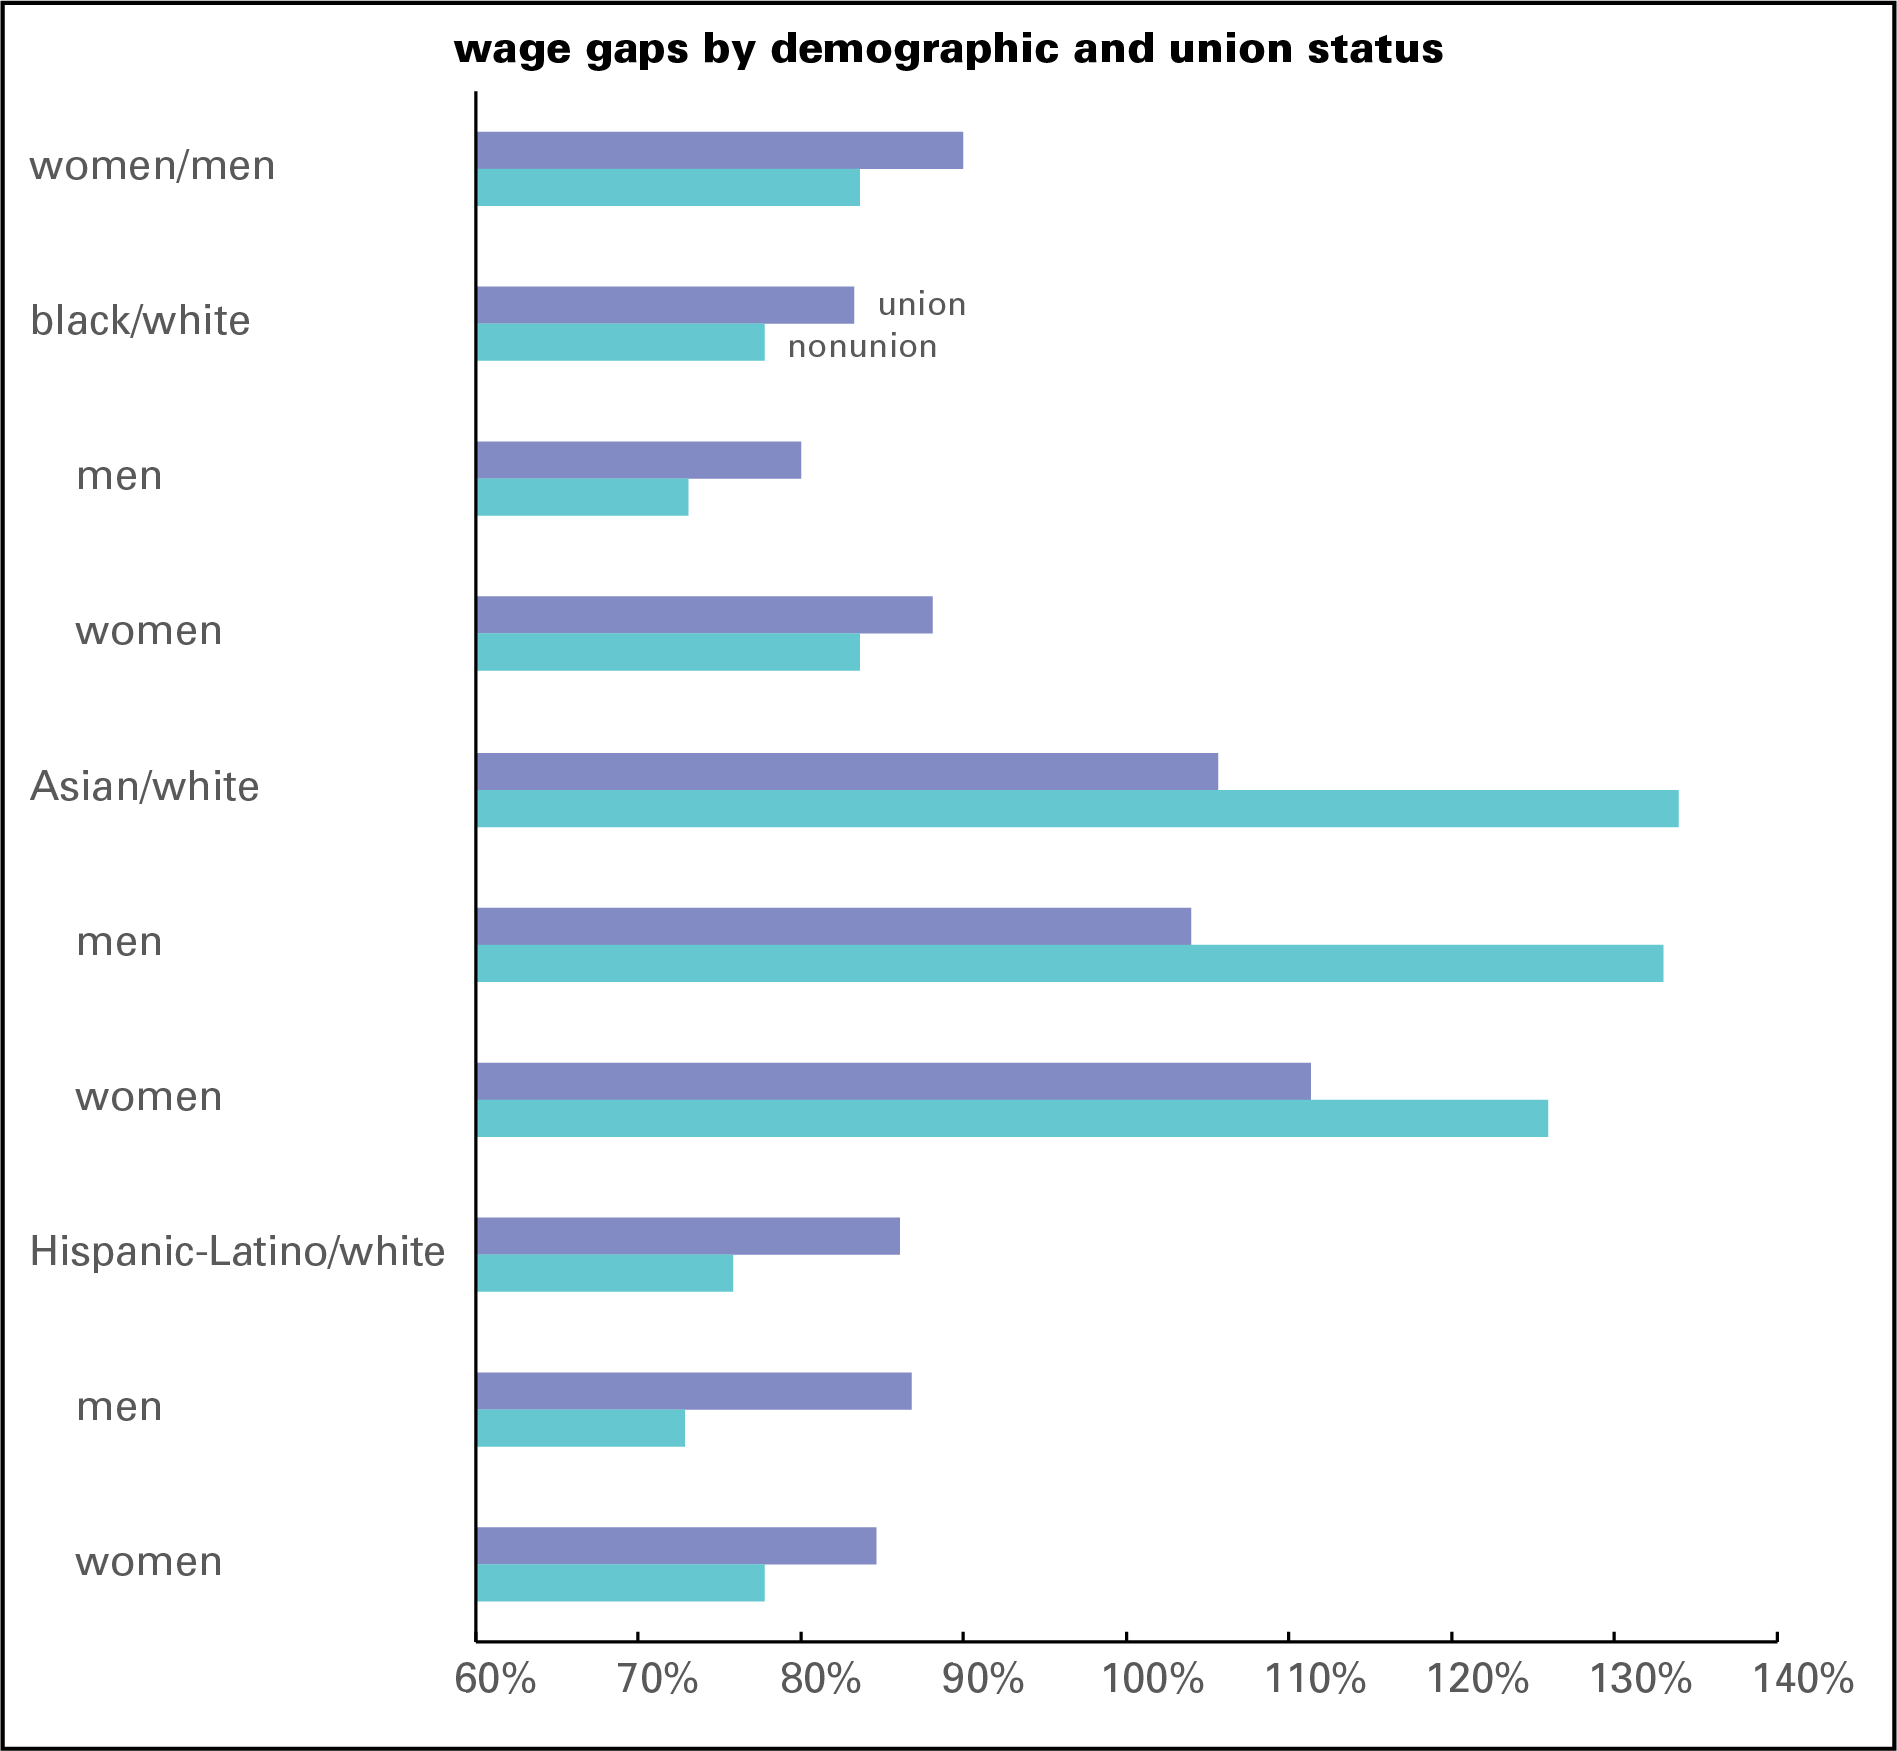
Not only are union wages higher in general, unions also compress traditional race and gender gaps. As the graph below shows, for all groups except Asian Americans union wages are higher, often substantially so—20% overall, as noted above, but 29% for black workers and 37% for Hispanics/Latinos. The Asian exception looks to be the result of a high concentration in high-wage, union-light sectors like tech.
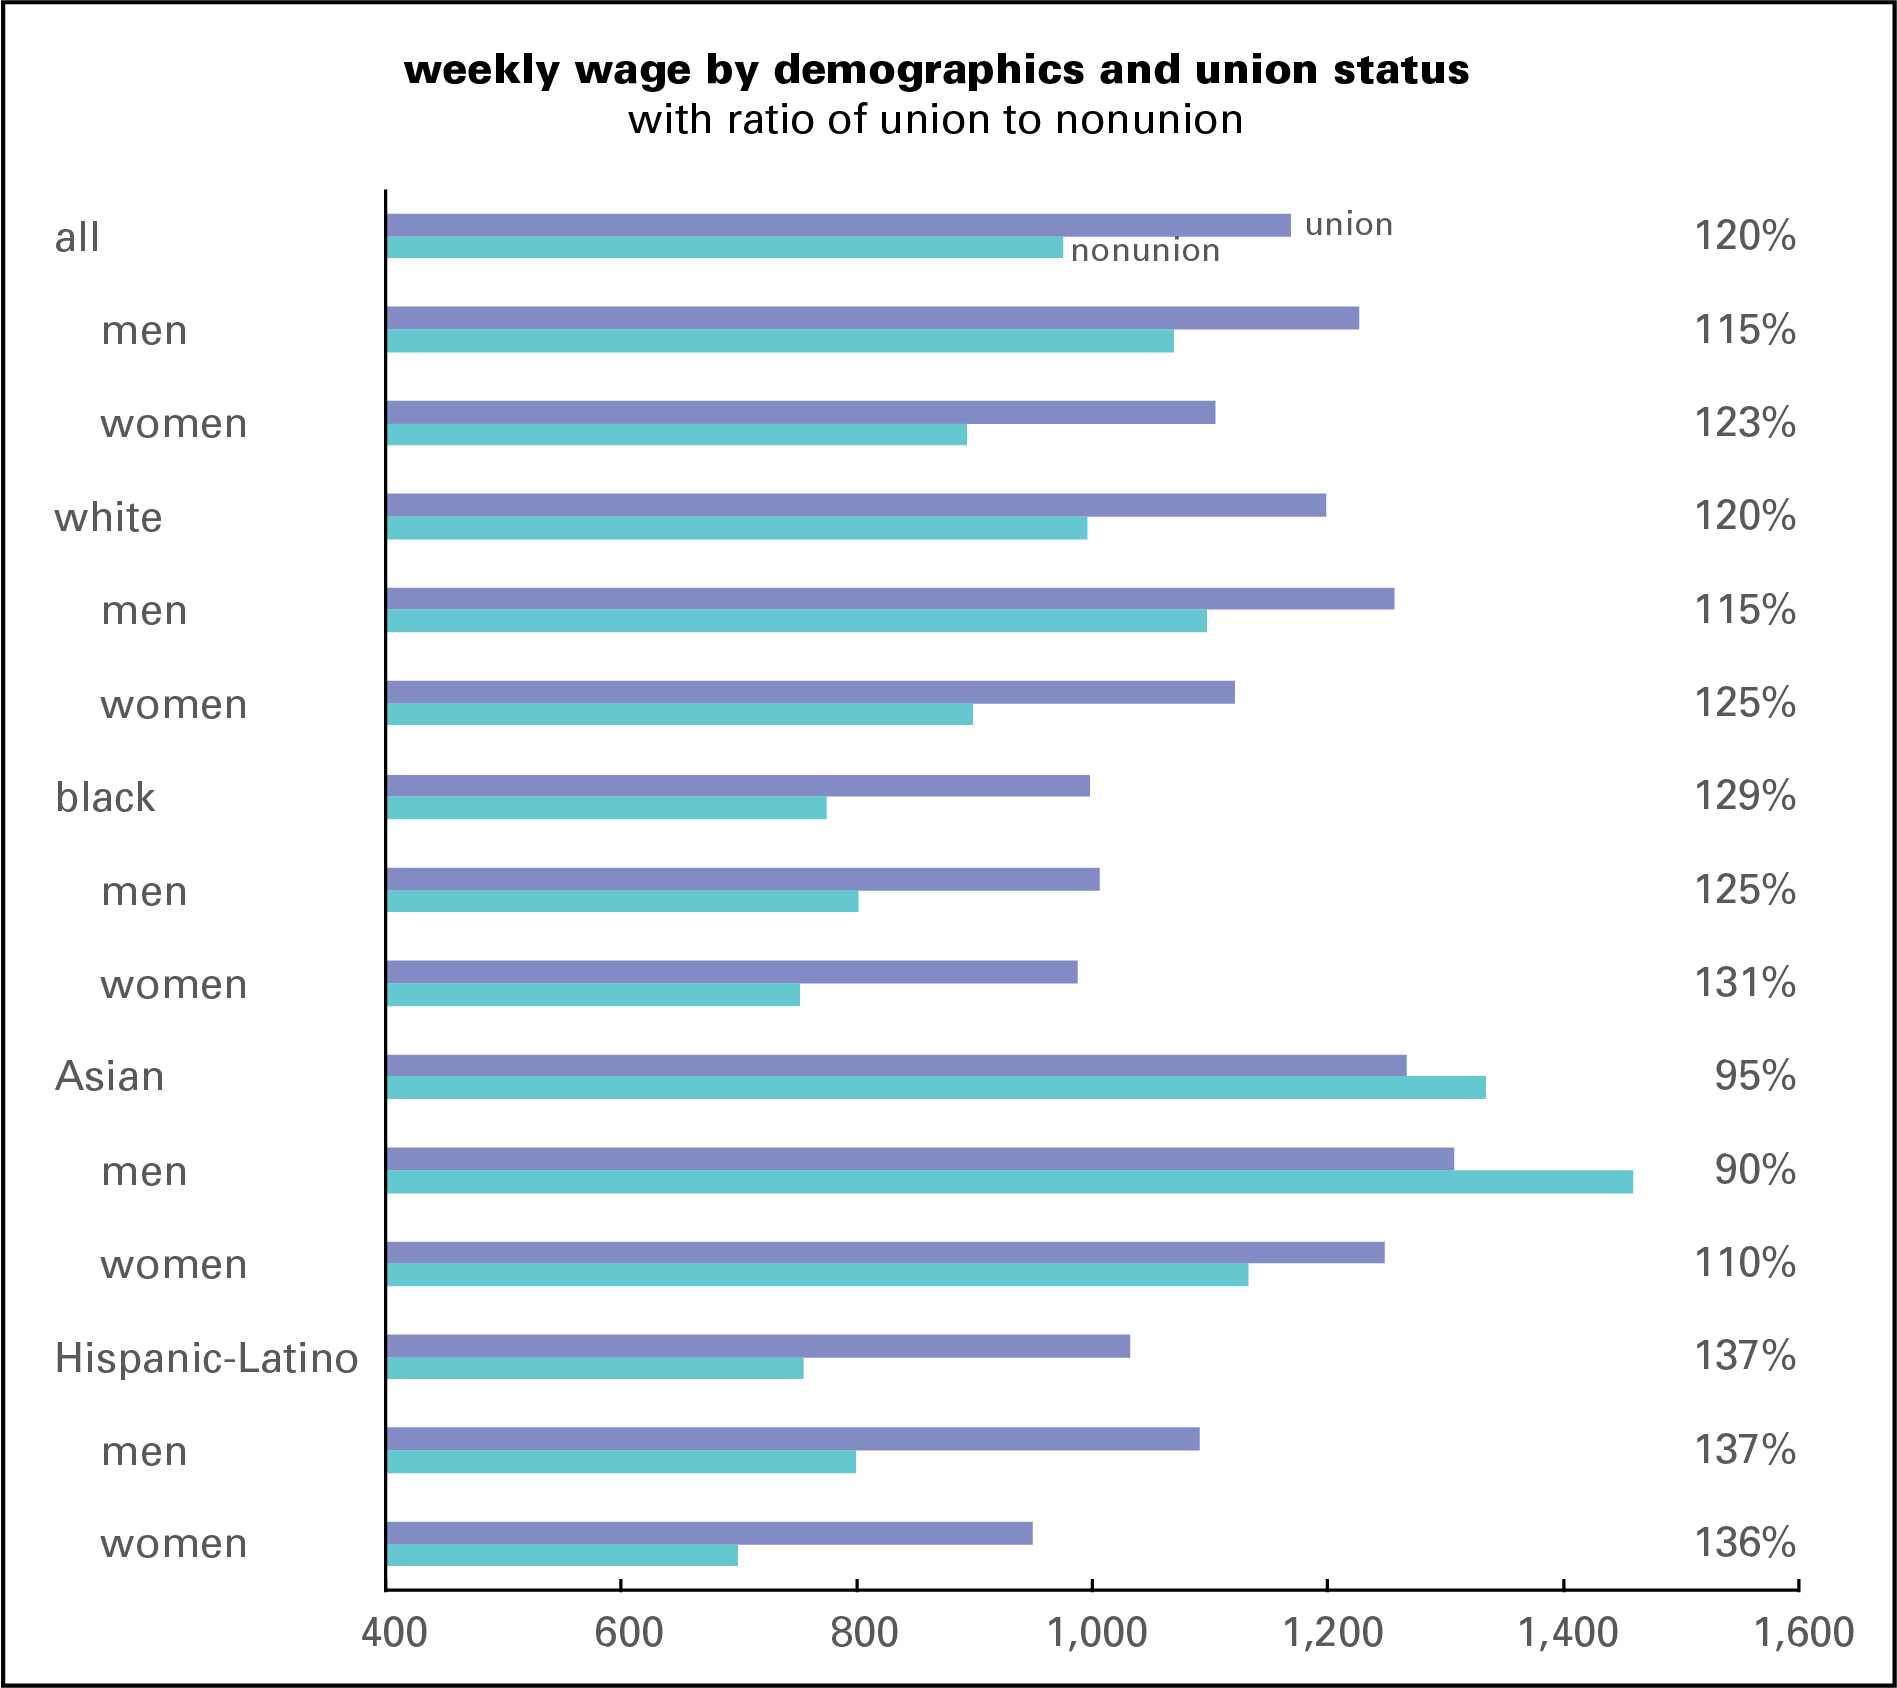
Overall, unionized women’s wages are 90% of unionized men’s; nonunionized women’s weekly earnings are 84% of nonunionized men’s. Black men’s wages are 80% of white men’s if they’re unionized; 73% if not. For women, it’s 88% and 84%. This runs counter to the myth that unions reinforce privilege. They counter it.
As I’ve done for several years in these annual union stats write-ups, I’ll conclude with this:
There are a lot of things wrong with American unions. Most organize poorly, if at all. Politically they function mainly as ATMs and free labor pools for the Democratic party without getting much in return. But there’s no way to end the 40-year war on the US working class without getting union membership up….
No strike wave in 2021
There was a lot of enthusiastic talk about a wave of labor militancy last year—remember “Striketober”? With the Bureau of Labor Statistics’ (BLS) preliminary data for December out—it will be slightly revised next month, but not by much—we can now look at the full year in historical perspective. It was a quiet year, even by recent standards.
First, the number of “stoppages” involving 1,000 workers or more.*
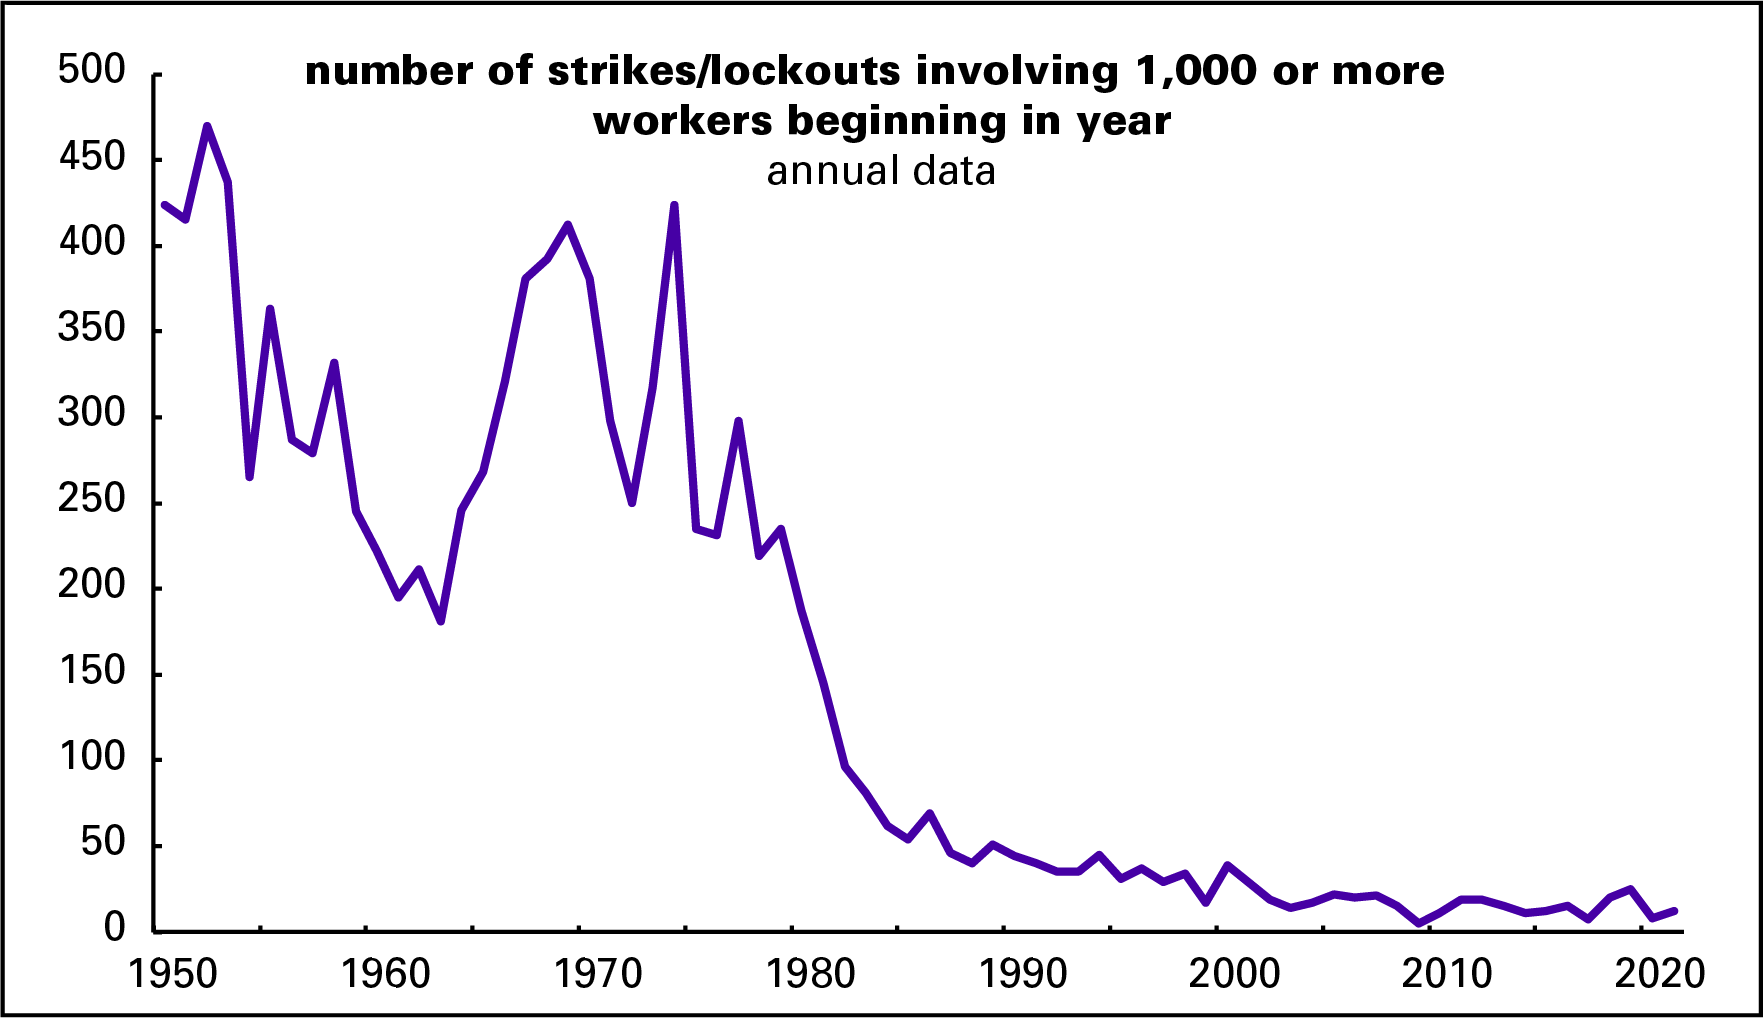
There were about half as many major strikes in 2021 as there were in 2018 (the year of the teachers’ strikes) and 2019 (which included a five-week strike against GM), and nothing compared to the pre-Reagan decades.
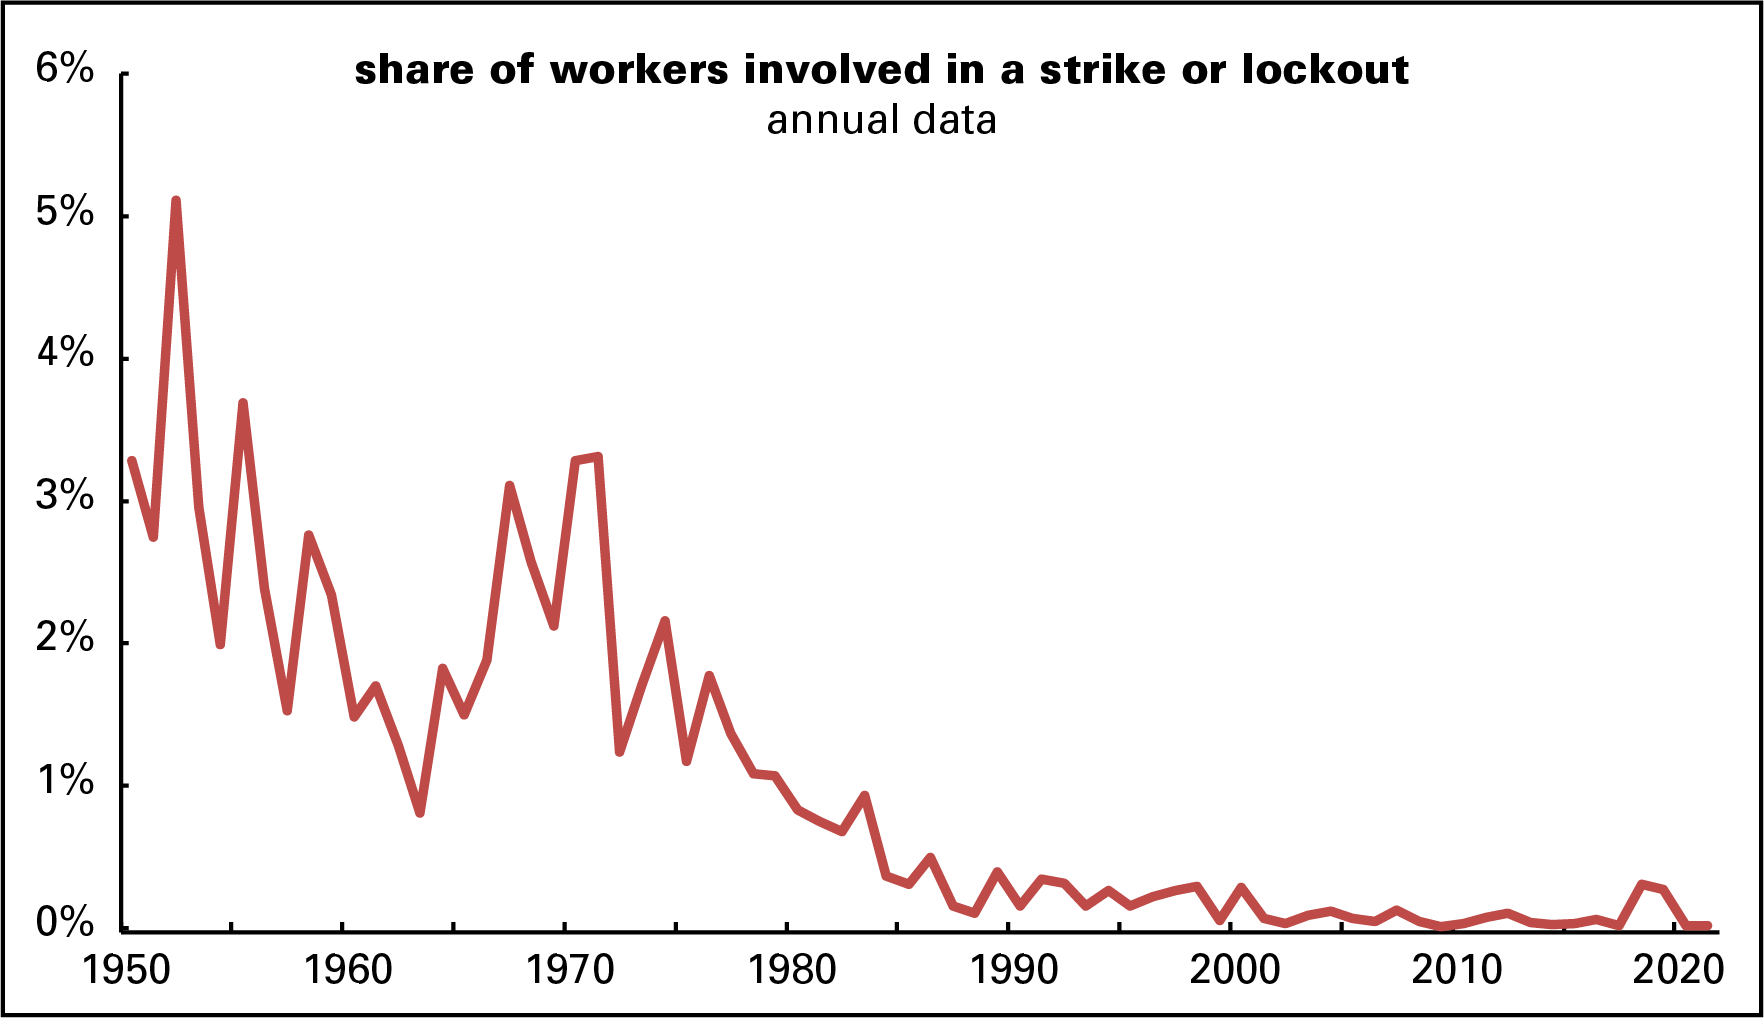
Comparing the number of workers involved in strikes to the labor force yields even less impressive results: 0.02% of total employment, a sixteenth as much as in 2018 and less than a hundredth the average of the 1950s. Even the 1990s, hardly a decade known for class struggle, saw eleven times the share of the workforce walking out.
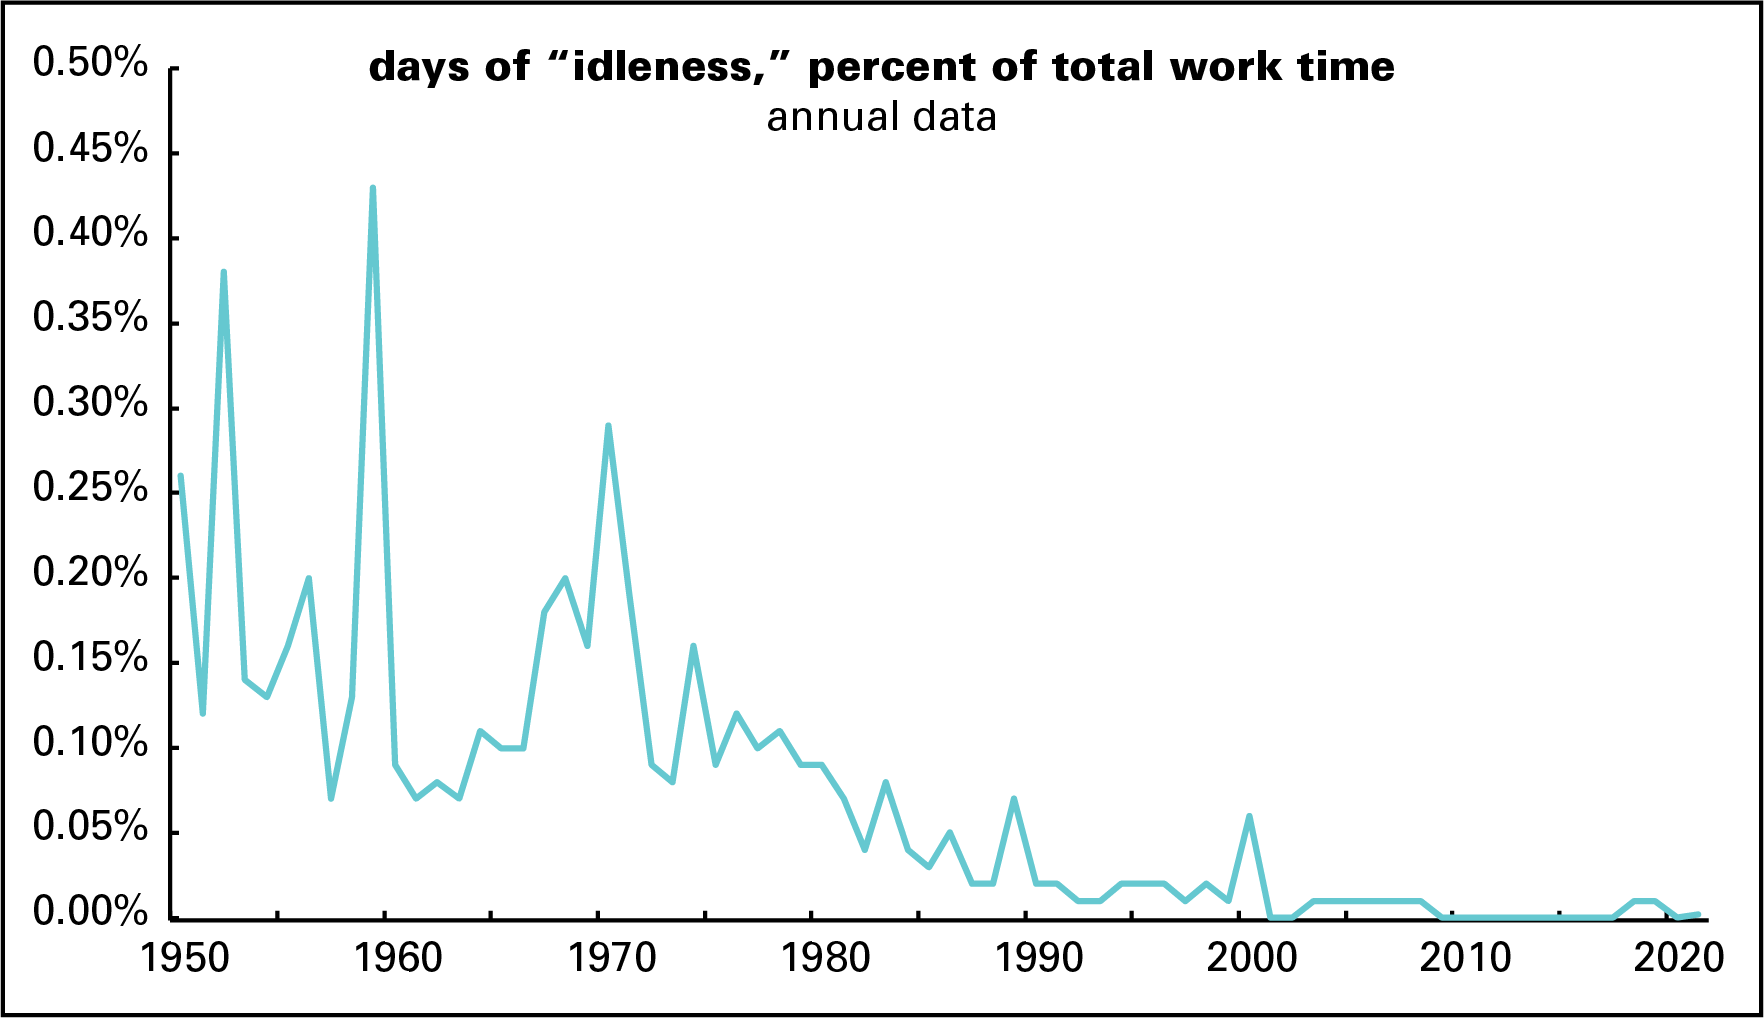
Yet another view: what the BLS calls, with a touch of moralism, “days of idleness” expressed as a percent of total hours worked. Again, the line is almost indistinguishable from the x-axis, so close it is to 0—0.002%, to be precise.
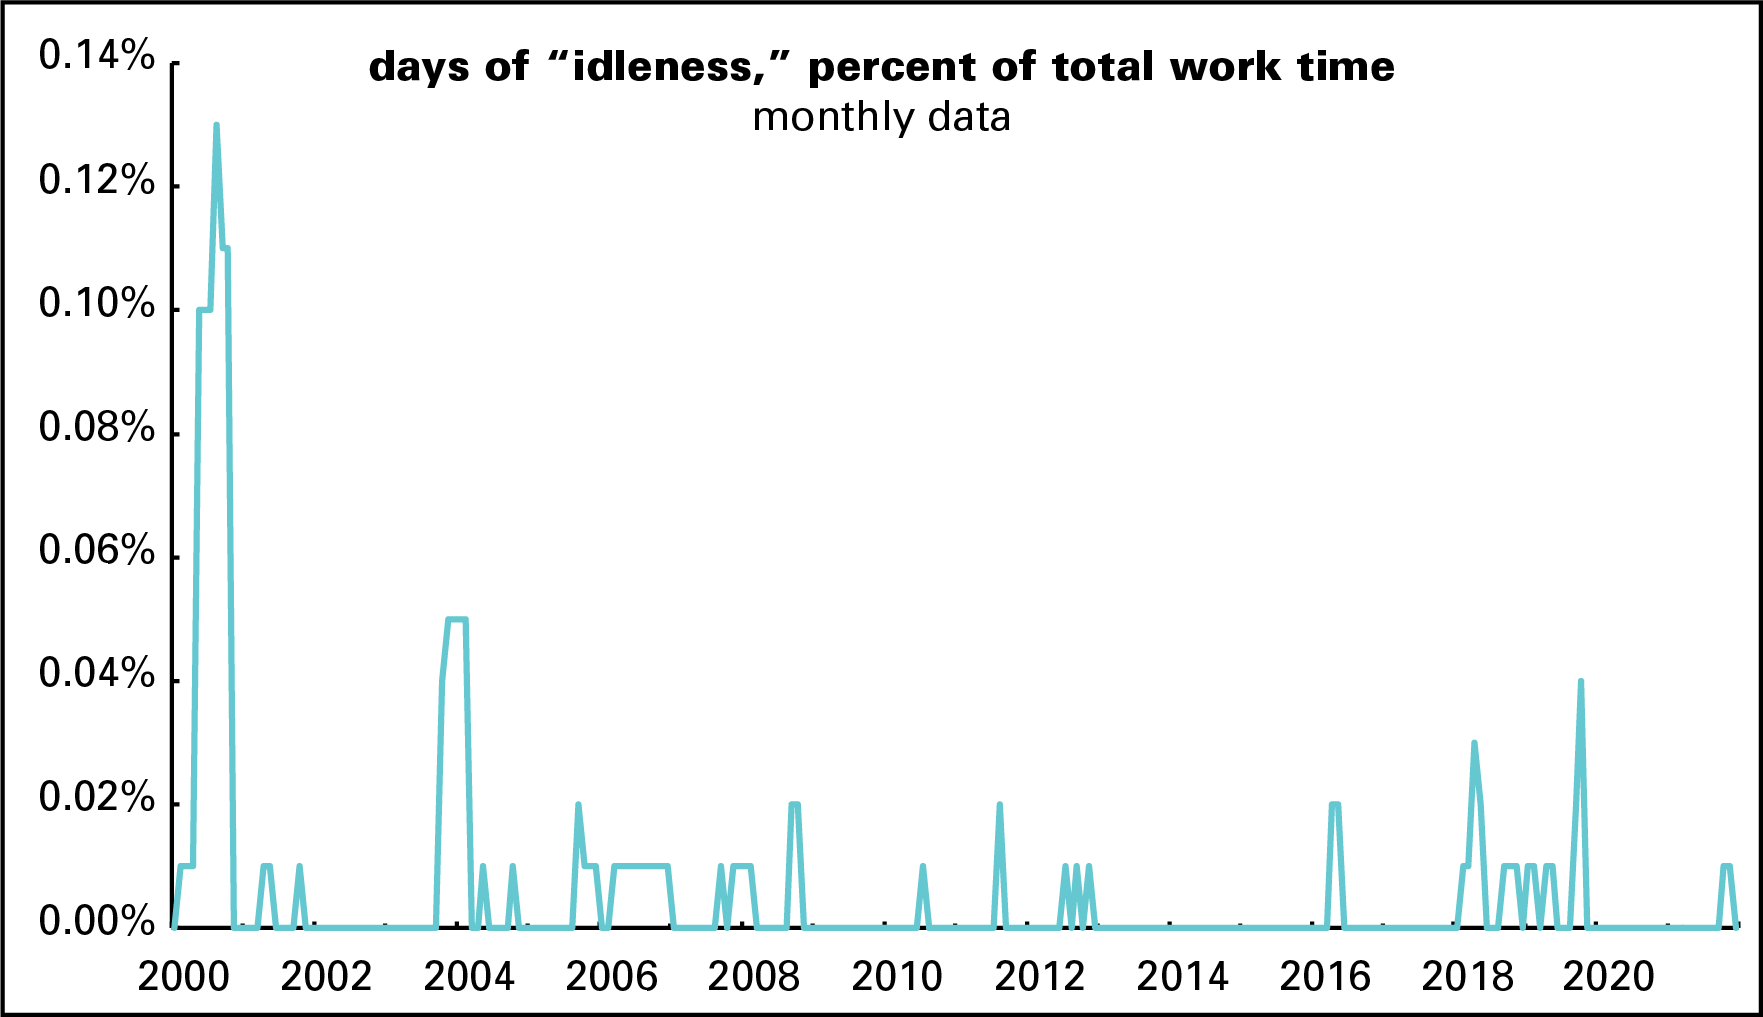
Here’s a closeup of the idleness measure since 2000 using monthly data. That blip on the right is what was called “Striketober,” even by bourgeois outlets like NPR. Hours of “idleness” during October 2021 were a quarter as many as in October 2019, the month of the strike against GM.
I’d love nothing more than a strike wave and an upsurge of militancy. It’s just not here yet.
* Two data notes: First, the BLS combines strikes and employer lockouts because exact causes can be hard to tell apart. And second, whenever I write these up, people say there are lots of smaller strikes that fall under the 1,000-worker limit. There aren’t really. The Federal Mediation and Conciliation Service (FMCS) used to publish data on smaller strikes, in an extremely user-unfriendly form. I wrote about that data in 2018 and they followed the same pattern as the larger strikes. The FMCS stopped updating the data in the early Trump years and the historical data has disappeared from their website.
Fresh audio product
Just added to my radio archive (click on date for link):
January 13, 2022 The new Cold Wars: Katrina vanden Heuvel on Russia • Tim Shorrock on China and North Korea
Fresh audio product
Just added to my radio archive (click on date for link):
January 6, 2022 William “Sandy” Darity, co-author along with A. Kirsten Mullen, of From Here to Equality, on reparations for black Americans
Nation pieces: inflation, AI
I had a couple of pieces in (on?) The Nation, recently.
The first is on inflation, which is real, not easy to solve, and a potential problem for a green agenda.
The standard remedy—raising interest rates and provoking a recession—would be disastrous in an economy still recovering from the Covid shock. But we can’t deny that huge deficit spending and an infusion of trillions of dollars conjured out of nothing has something to do with the problem. The deficit spending financed a remarkably generous, though too temporary, aid package. It boosted household incomes despite sudden and massive job loss in the early months of the pandemic. That aid is still keeping millions of households afloat and has left many others with unusually large savings balances.
It would be a crime to take those benefits away, but an immense amount of purchasing power was introduced into an economy that was stretched to the limit, with workers in some areas hard to find, taut global supply chains vulnerable to interruption (a lesson for labor militants!), a preference for keeping only the thinnest possible stock of inventories, and a public infrastructure ragged from decades of underinvestment.
And the second is a review of former Theranos board member Henry Kissinger and former Google CEO Eric Schmidt at the Council on Foreign Relations, chewing the fat about AI.
Just for a moment, let’s cede the point that AI is something big that is changing the way we live. Schmidt and especially Kissinger worry about what this means for being human. (It’s weird when the architect of the secret bombing of Cambodia becomes the humanist on the program, but such are the politics of elite organizations.) Over the next 15 years, Schmidt claims, computers will increasingly set their own agenda, exploring paths and producing results beyond the intention or understanding of their human programmers. What will this do to our sense of ourselves, Schmidt asked, “if we’re not the top person in intelligence anymore?”
One response might be, “Well, maybe don’t let them go there?” But the authors will have none of that. “Once AI’s performance outstrips that of humans for a given task, failing to apply that AI, at least as an adjunct to human efforts, may appear increasingly as perverse or even negligent,” they declare. Will we delegate our war-making capacities to machines—not merely in guiding weapons to their targets but deciding whether to attack in the first place? Schmidt apparently thinks so, though he acknowledges that there are some complexities. “So, you’re in a war and the computer correctly calculates that to win the war you have to allow your aircraft carrier to be sunk, which would result in the deaths of 5,000 people, or what have you…. Would a human make that decision? Almost certainly not. Would the computer be willing to do it? Absolutely.”
I meant to add, Henry Kissinger would have made such a decision.
Fresh audio product
Just added to my radio archive (click on date for link):
December 30, 2021 Ben Burgis, author of Christopher Hitchens, on why he still matters • Patrick Blanchfield, author of this article, on the death drive
Who’s not getting vax’d and why
This is hardly an exhaustive treatment of a complex topic—just a quick attempt to illuminate who isn’t getting vaccinated against covid-19 and why. I started looking at these stats after a Twitter exchange and I thought I’d share the resulting graphics. The stats are drawn from the Census Bureau’s Household Pulse Survey—health table 5a, two-week period ending December 13, for those who are keeping score at home.
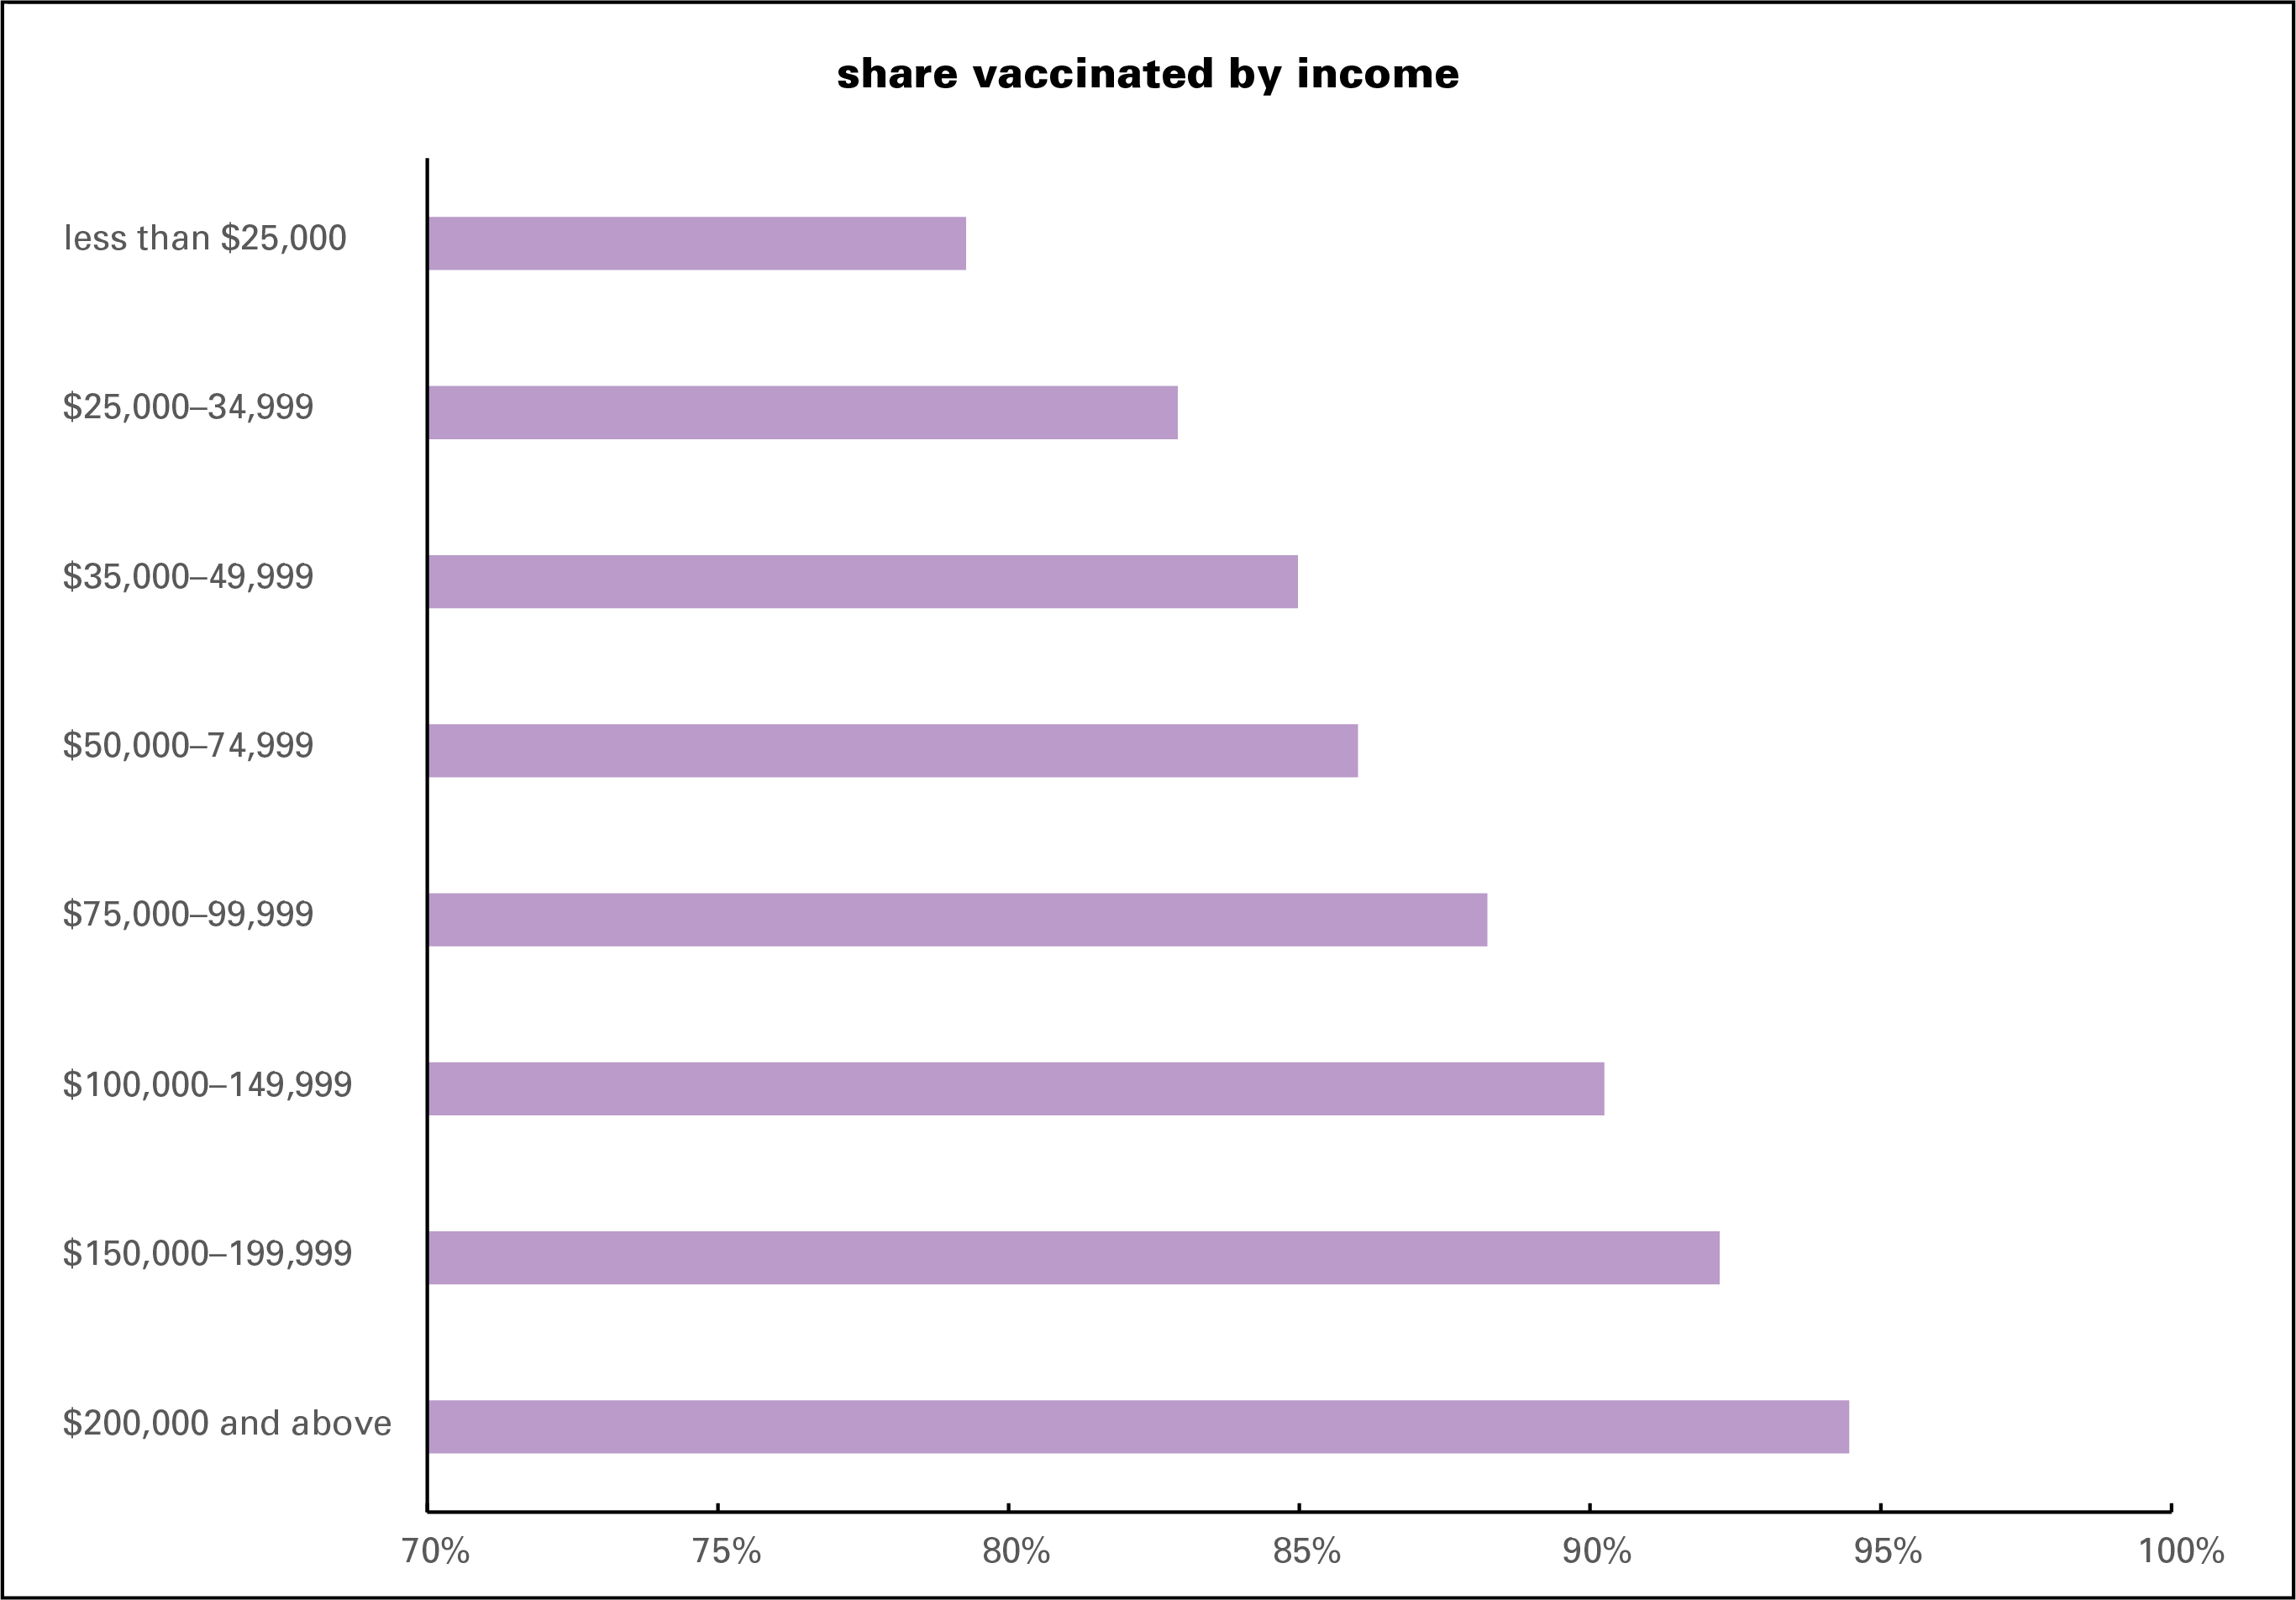
First, vaccination rates by income. Almost 80% of people in the lowest income category, report having gotten at least one shot—51% have gotten two and 22% have gotten three. This is the lowest of any income category, and the share rises as you go up the income ladder. It tops off at 95% who’ve gotten at least one shot among the $200,000+ set. (The under-$25,000 group accounts for 12% of the population; over $200,000, 6%.) Over half, 55%, have gotten three. By the way, racial gaps have largely disappeared; 82% of blacks and 84% of whites have been vaccinated.
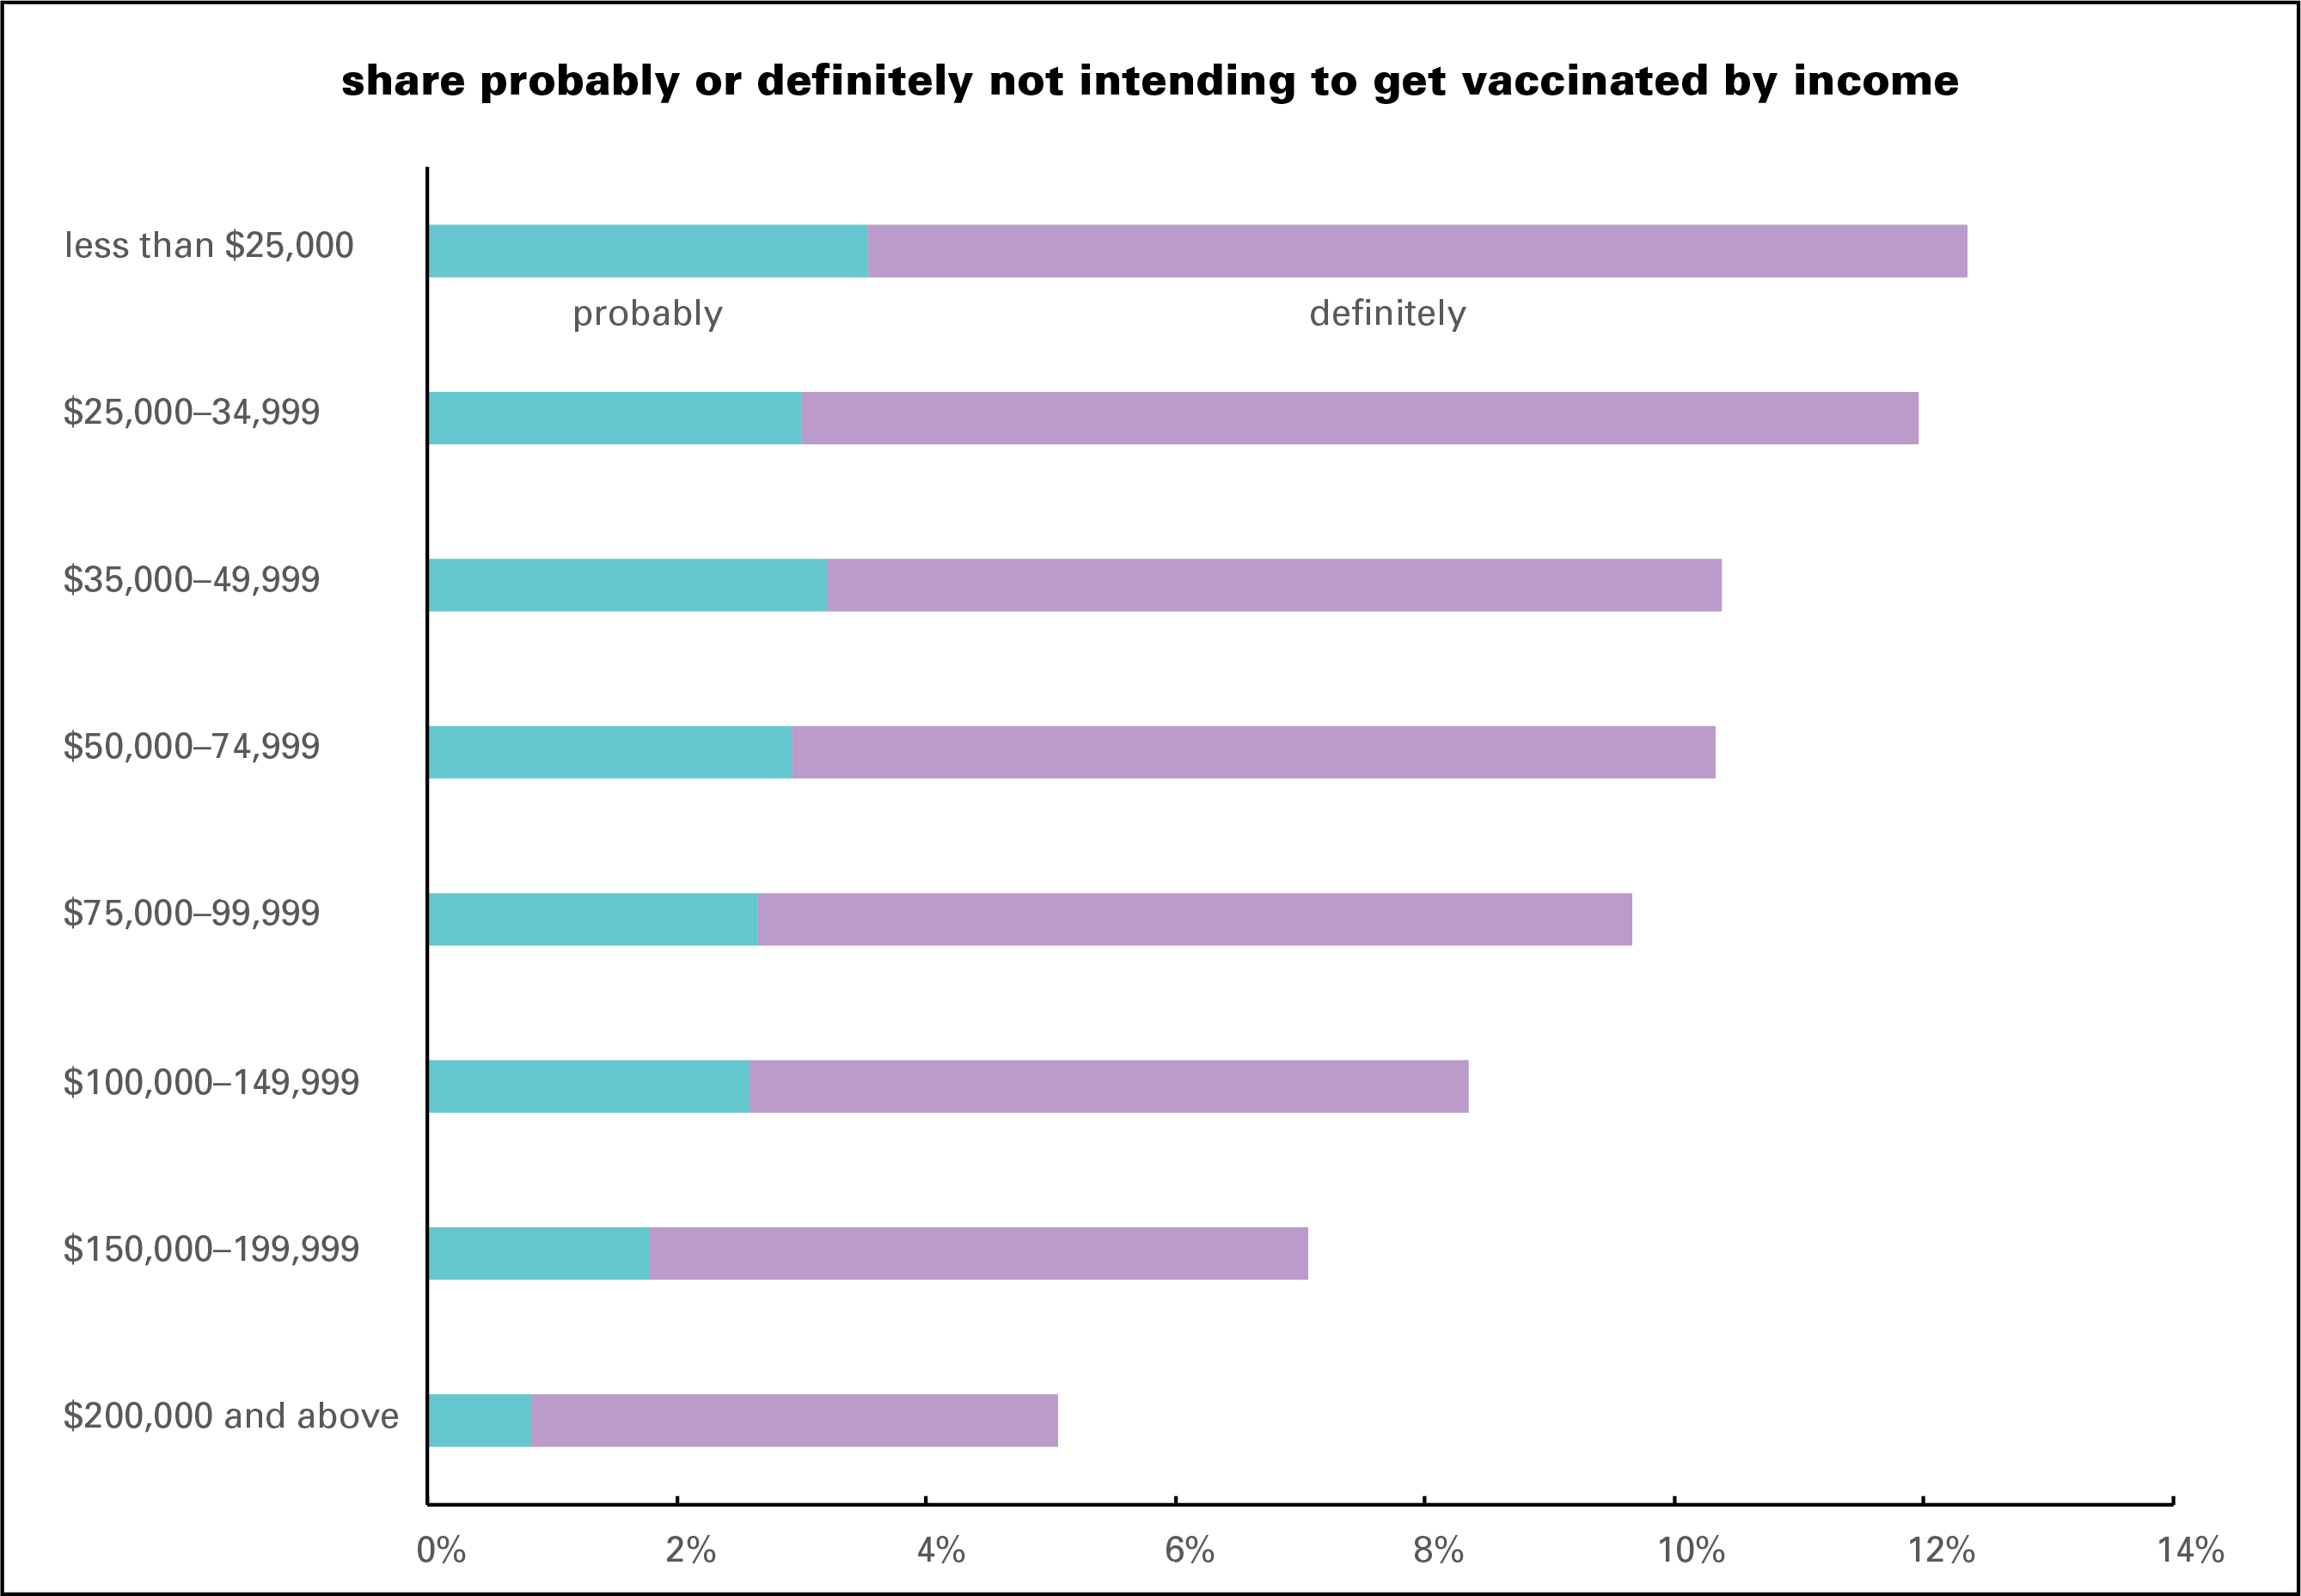
And now a closer look at vaccine refusers—the share saying they will probably or certainly never take a shot. The highest share of refusers are in the lowest income bracket. Here the gradient isn’t as steep as with vaccination rates: about 9% of the bottom two income categories are determined never to take the needle, as are 7% of the next three. Then it starts falling, bottoming out at 4% of the richest group. In all categories, “definitely” exceeds the “probably” by 2–3 times.
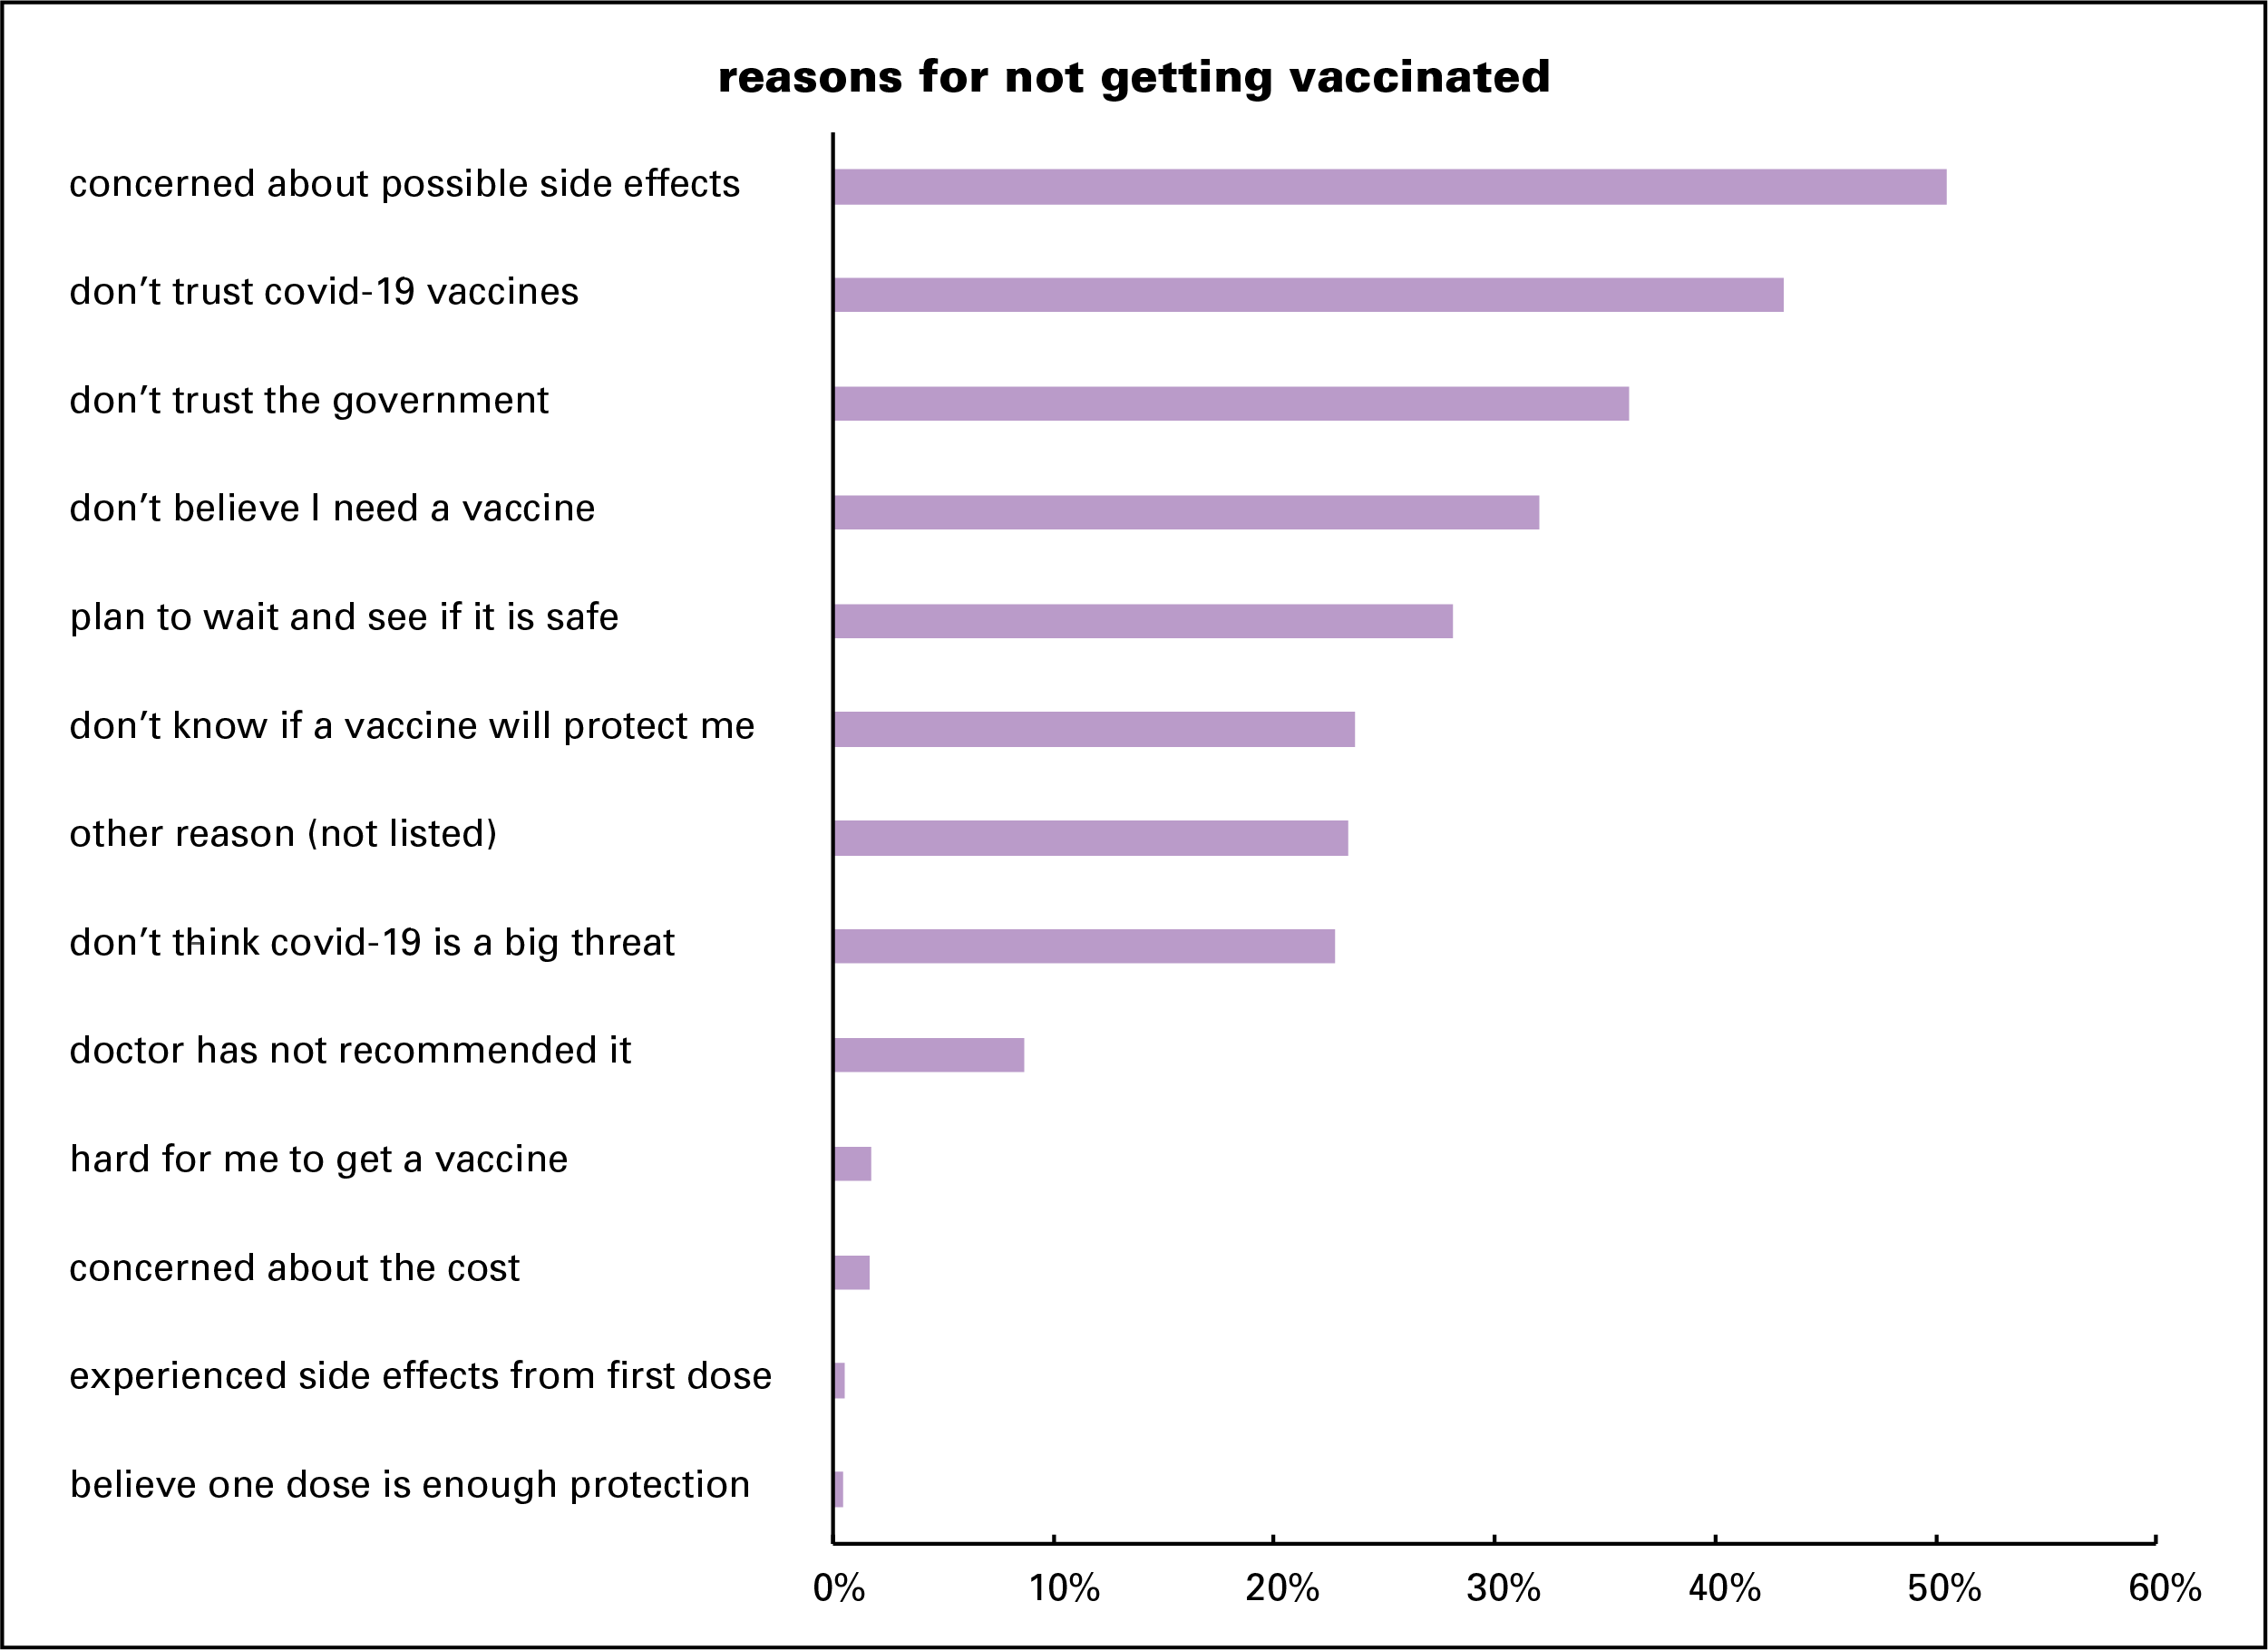
And now reasons for not getting vaccinated. On the left, you often hear it said that difficulties getting a shot (sorry, can’t say “jab”) or worries about cost are important factors, but they’re way down on the bottom of this survey. Fear of side-effects, distrust of vaccines and/or the government, and belief in one’s invincibility are far more prominent reasons. Given these reasons, it’s not clear how persuadable the hard-core resisters would be with mere argument.
Fresh audio product
Just added to my radio archive (click on date for link):
December 16, 2021 Sam Adler-Bell, author of this article, on the young counterrevolutionary new right • Jesse Eisinger of ProPublica on how the very rich can pay no taxes
Fresh audio product
Just added to my radio archive (click on date for link):
December 2, 2021 Matt Kierkegard and David Adler of the Progressive International on the Honduran and Chilean elections • Sarah Lustbader, author of this article, on why trials are no substitute for politics
Fresh audio product
Just added to my radio archive (click on date for link):
November 25, 2021 Alex Vitale, just out with an updated edition of The End of Policing, on what cops really do and how we can get rid of them • Barry Eichengreen, co-author of In Defense of Public Debt, on the very long history of public borrowing
Fresh audio product
Just added to my radio archive (click on date for link):
November 18, 2021 Christina Gerhardt on the COP26 climate summit • Mike Lofgren on the dangers of Steve Bannon’s war on the administrative state (article here)
Americans staying put
There are certain things that people say that sound so true that others repeat them credulously without feeling the need to cite evidence. Two covid-era favorites: everybody’s working from home (WFH). And people have decamped en masse for the hinterlands, thanks to WFH. Neither is really true.
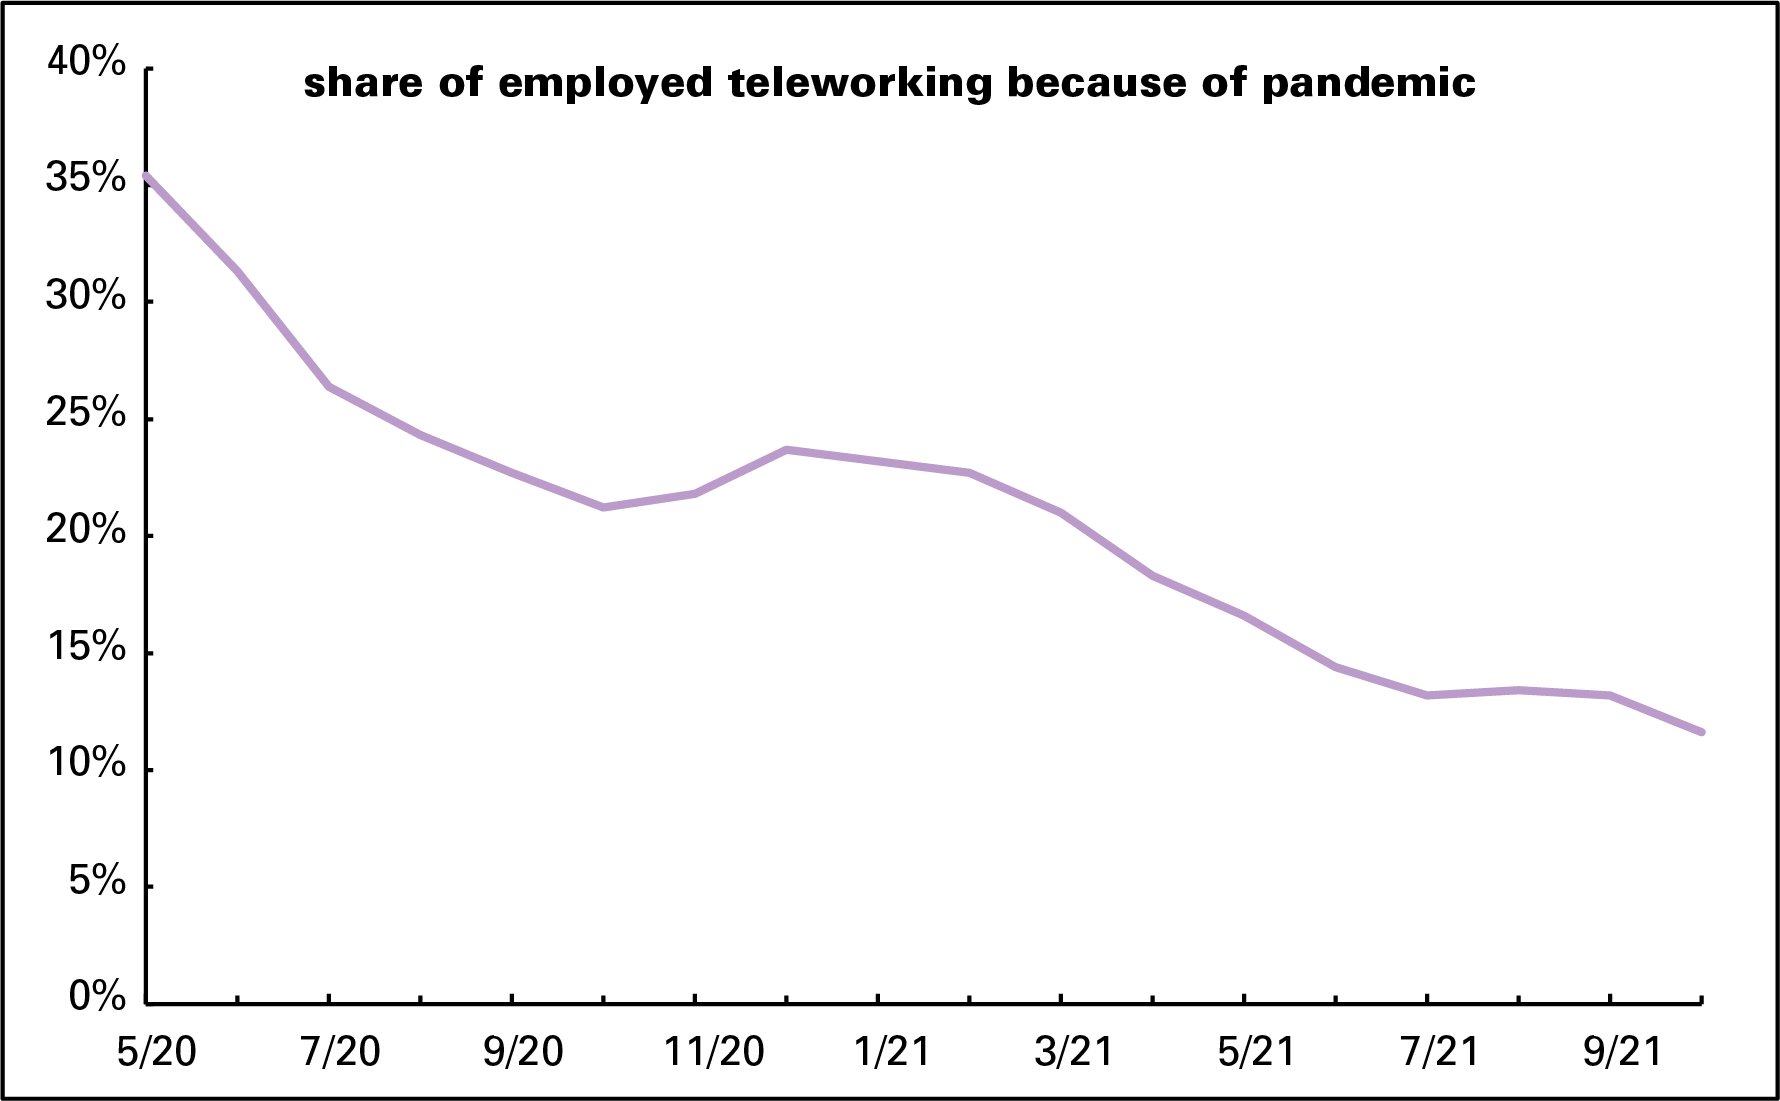
I wrote about the slim WFH numbers in September. In July, which was the most recent month available then, 13.2% of the employed were teleworking, the Bureau of Labor Statistics’ favored term. In October, that had fallen to 11.6% (graph below). Their ranks were still dominated by highly credentialed professional and managerial workers. The miserably paid couriers who brought (and still bring) them food and other essentials were most certainly not working from home, though they easily fall out of some people’s conception of “everybody.”
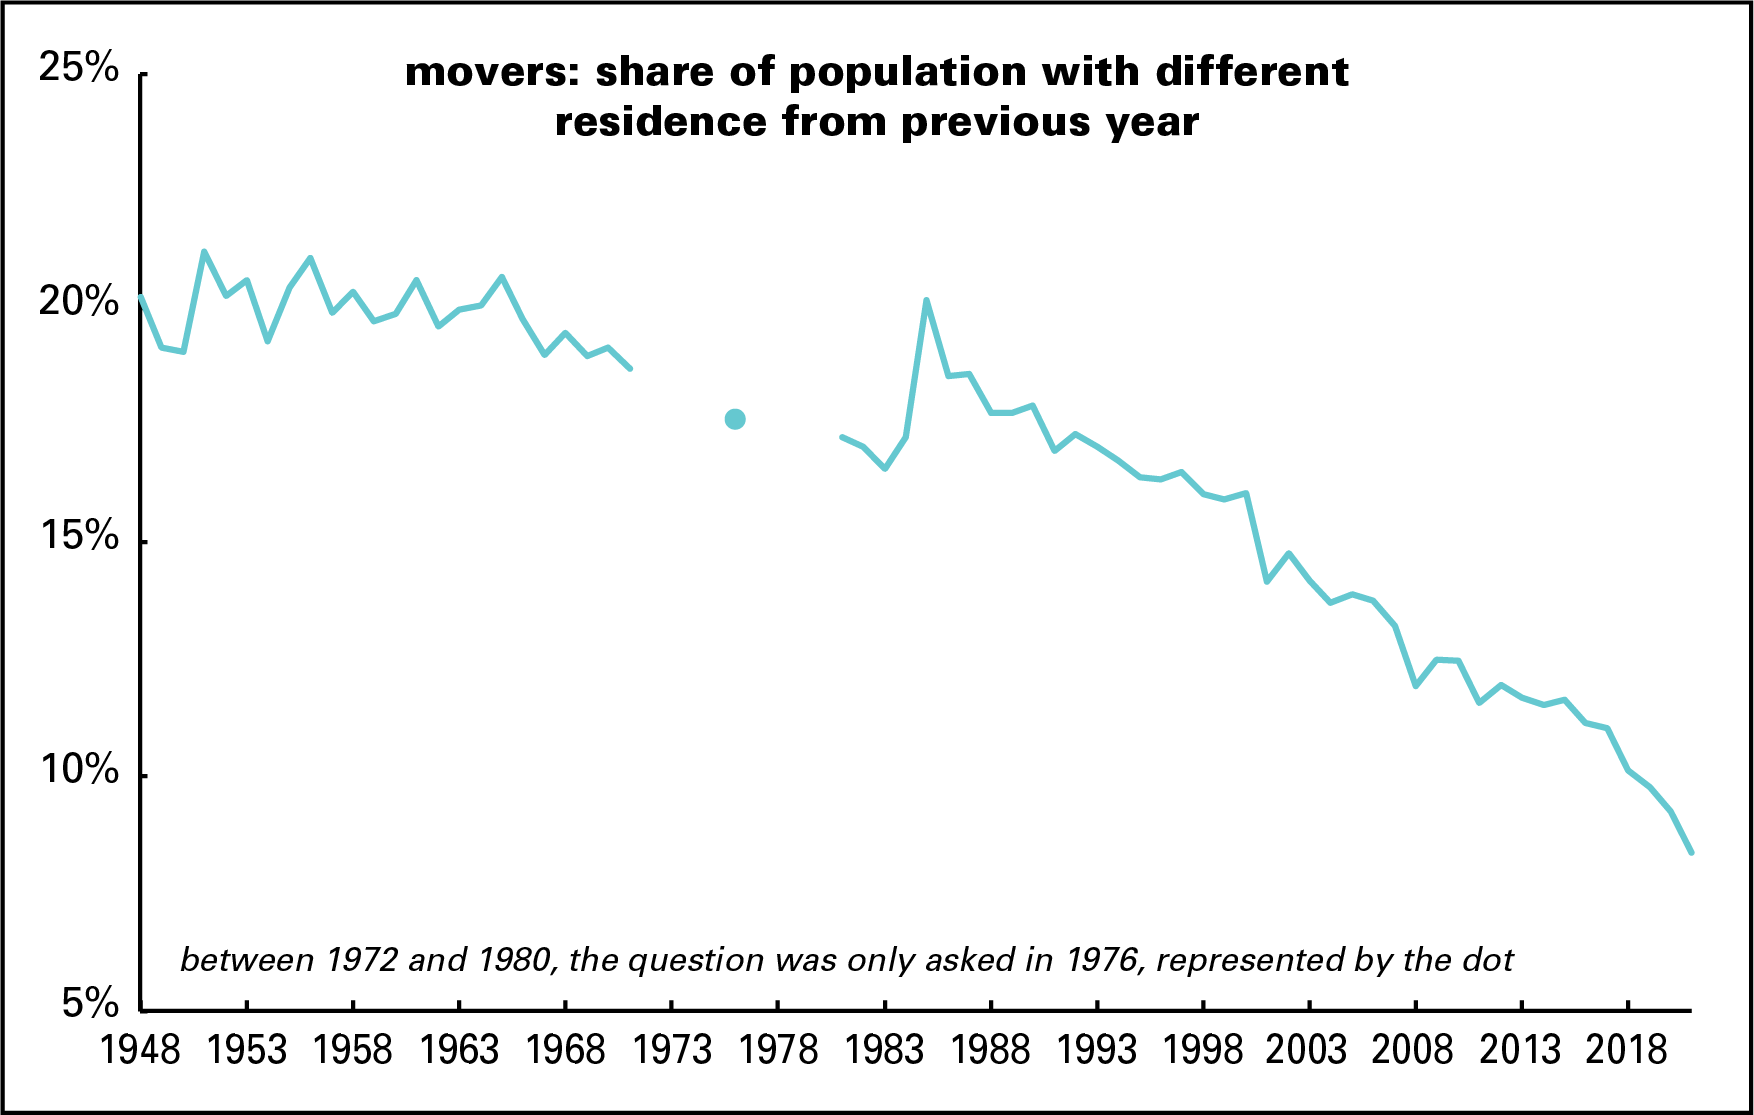
Even if “everybody” wasn’t teleworking, lots were. But there’s no support at all for the mass decampment story. Freshly released data from the Census Bureau shows just 8.4% of Americans moved between 2020 and 2021, the smallest share since the Bureau started counting in 1948. That was down almost a full percentage point from the previous pair of years, a large decline by recent historical standards. But as the graph below shows, the share has been declining steadily since 1985’s 20.2%, when high oil prices and deindustrialization drove movers south and west in search of jobs. (Unfortunately for the energy migrants, oil prices collapsed in 1986.)
Also not surviving a confrontation with Census data: the claim that, freed from the need to go to an office, covid refugees headed for the hills (and beaches) in large numbers. They didn’t, as the next graph shows.

Yes, people have been moving out of cities for decades, but the net out-migration of 0.5% of the national population was smaller than the two previous years, and over a quarter less than the 1986–1999 average. (Reminder: these numbers count only in- and out-migration, not changes in population levels, which are also affected by births and deaths.) As the trendline shows, urban out-migration has been in a slowing trend since this data series began. Suburbs gained migrants, but at a rate slightly lower than the previous eight years. Metro areas—the combination of suburban areas and the “principal” cities associated with them— have seen steady, if declining, in-migration for all of the last 35 years. And nonmetro areas, supposedly the recipients of all those terrified urban refugees, lost migrants between 2020 and 2021—more, in fact, than any year since 2014.* That trendline ambles very lazily downward, though it’s hard to distinguish from the axis, because it’s so close to 0.
A larger question here, pandemic aside, is what happened to American mobility? Pulling up stakes and moving a long distance in search of fresh opportunity used to be a foundational national myth. Like many others, it needs to be retired.
* The Census Bureau reminds us that nonmetropolian areas are not the same as “rural” areas, since there are many rural-feeling regions that are nonetheless technically part of metro areas. Census has a point, but on the other hand, there are social differences between thinly populated areas that are close to major conurbations and those that aren’t. For example, parts of Westchester County, just north of New York City, may look rural, but it’s amenity-plentiful rich people’s country, and a short train ride away from the big city.

