
Fresh audio product
Just added to my radio archive (click on date for link):
March 19, 2020 David Himmelstein of Physicians for a National Health Program and CUNY on how US health policy got us to this desperate pass • Helen Yaffe on Cuban interferon and COVID-19, and the country’s biotech industry and health system (YUP article here)
Why UI isn’t enough
I’m going to be posting a series of commentaries on the current crisis. Here’s a quick first
It’s odd to see Democrats like Pelosi and Schumer objecting to Republican schemes to send everyone a check for $1,000, maybe two. Of course, one- or two-off checks for $1,000 won’t pay many of the the bills for very long. But talk of means-testing right now looks mean, cheap, and politically suicidal.
Schumer says that rather than write checks, we should expand unemployment insurance (UI) benefits. It would have to be some expansion. Benefits are low, of short duration, and available to a smaller share of the unemployed than in the past.
Right now, the average UI check is $372 a week and the average duration of benefits is just under 15 weeks. That works out to a total of $5,515. While well above $0, it still won’t take you very far. During the worst months of the last crisis, in early 2010, the average check was $307 and the duration of benefits 20 weeks, for a total of $6,236. That’s about a tenth the average household’s yearly income ($63,179).
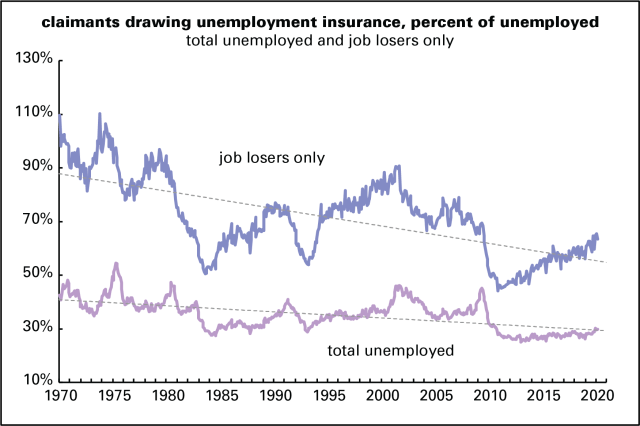
And the share of the unemployed drawing benefits has declined over the decades. Now, less than a third of the unemployed are drawing benefits. (Those are known as “continuing claims,” in the jargon). In the 1970s it was around 40%, sometimes as high as 50%. The unemployed include people who’ve quit their jobs voluntarily, or are just entering or reentering the workforce. If you take them out and compare continuing claims to the number of job losers among the unemployed, the numbers are higher, but still dispiriting: not quite two-thirds. It was actually lower in the aftermath of the 2008–2009 crisis, just over 50%. In the 1970s, it was between 90% and 110% (!). It’s all in the graph below.
One wonders what sort of expansion Schumer has in mind, but it would have to be a very serious expansion to be of serious help in the coming months. In the meanwhile, don’t complain about $1,000 checks.
Fresh audio product
Just added to my radio archive (click on date for link):
March 12, 2020 Kali Akuno on why black voters like Joe Biden • Dibyesh Anand on the belief system of India’s Hindu Fascists (book here)
Fresh audio product
Just added to my radio archive (click on date for link):
March 5, 2020 Andrew Bacevich, historian and president of the Quincy Institute, on the history and structure of the US permanent war mobilization (Harper’s article, The Age of Illusions) • Chris Brooks on the UAW bribery/embezzlement scandal (articles: ITT, Intercept)
No robo
You can hardly look at Twitter without reading something about the impending AI revolution: robots are coming for your job. I’m a skeptic. By that I don’t mean to argue that IT and AI and all the other abbreviations and acronyms aren’t changing our world profoundly. They are. Tech affects everything—work, play, love, politics, art, all of it. But the maximalist version, where robots, equipped with artificial intelligence, are going to replace human workers, is way over done. No doubt they will replace some. But not all.
Back in 1987, ancient history in tech time, the economist Robert Solow observed, “You can see the computer age everywhere but in the productivity statistics.” That observation achieved cliché status, but unlike many of that breed, it was true. Productivity—measured as the dollar value of the output per hour of work, adjusted for inflation—had fell below its long-term average in the mid-1970s, one of many signs of the end of the post-World War II Golden Age, and would say there for 20 years. (See the graph below. Trend productivity in the graph is computed with a Hodrick–Prescott filter.)
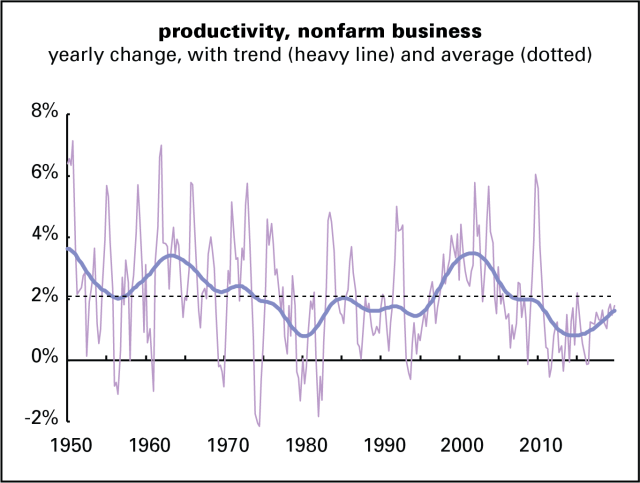
Then, around 1995, productivity accelerated with the commercialization of the internet and the dot.com boom, which came with a surge in corporate investment in IT. Solow’s quip was retired, and the dawn of a new era was pronounced. Curiously, that productivity acceleration was a time of low unemployment and rising real wages—unlike the present, when unemployment is low but wage growth sucks. So by that precedent, there’s no reason to associate a productivity acceleration with job loss.
That new era lasted only about ten years. Productivity fell back into a slump, reaching all-time lows from 2014 to 2016. It’s picked up some since, but trend productivity growth is at levels comparable to the productivity slump of the late 1970s, 1980s, and early 1990s. So, we’re back in the land of Solow’s quip: robots aren’t visible in the productivity stats.
Here’s another way to look at it. Historically, it took just over 2% of GDP growth to generate a 1% increase in employment. For most of the last decade, employment growth has outstripped that historical norm. Lately the US economy has added almost 40,000 jobs a month more than GDP growth would suggest. That compares to an average gain lately of around 200,000. In other words, one out of every five jobs being produced in the US today wouldn’t be here if normal relationships between growth and employment were still holding sway. (See the graph below.)

GDP growth—which has been slow by historical standards—has also been producing larger declines in unemployment than you’d expect if old relationships were still in effect. If the robots were moving in, you’d expect just the opposite—job growth badly lagging economic growth, unemployment stickier than it has been. But these things are just not happening.
Maybe they will, though we’ve heard panicked tales of disappearing human workers since the onset of capitalism. Cries of alarm like “the robots are coming!” undermine the confidence of the working class and make people more grateful for whatever crap the system feeds them than they should be. Economic life is hard enough as it is without promoting mechanical competitors.
Fresh audio product
Just added to my radio archive (click on date for link):
February 20, 2020 Colleen Eren, author of Bernie Madoff and the Crisis, on why the Ponzi schemer deserves release from prison (op-ed here) • Jamieson Webster psychoanalyzes money and left melancholy (interview with Fiona Alison Duncan here)
Fresh audio product
Just added to my radio archive (click on date for link):
February 13, 2020 Yasha Levine on Chrystia Freeland, Ukrainian Nazis, and the proxy war against Russia • Lizzie O’Shea, author of Future Histories, on fake techno-utopianism and imagining a better future
Fresh audio product
Just added to my radio archive (click on date for link):
February 6, 2020 Sofia Japaridze on Congressionally protected wage theft in the libertarian paradise of post-Soviet Georgia • Margaret Kimberley, author of Prejudential, on the long, oppressive relationship of presidents to black people
Fresh audio product
Just added to my radio archive (click on date for link):
January 30, 2020 John Clegg, co-author of this article, on the economic roots of mass incarceration • Tobita Chow & Jake Werner, authors of this paper, on the US–China trade war
Union density: yet another low
Preparing to write up the 2019 union density statistics from the Bureau of Labor Statistics, I looked at last year’s and was tempted just to copy–paste. Here’s the lede, as we say in journalism:
Union density—the share of employed workers belonging to unions—fell to 10.5% in 2018, the lowest since the Bureau of Labor Statistics began reporting the data in its modern form in 1964, down from 2017’s 10.7%.
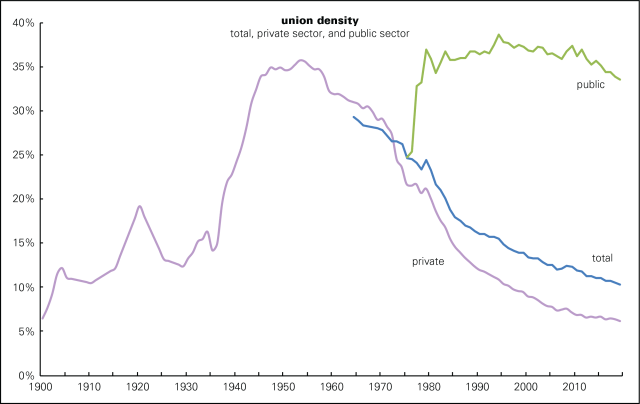
The only edit I’d have to make in this bit is to change “10.5% in 2018” to “10.3% in 2019.” Similar things could be said for subsequent sentences. Union membership for private sector workers fell 0.2 point to 6.2% and 0.3 for the public sector, to 33.6%. (See graph below.) The private-sector number is an all-time low, and down almost 30 points from its 1953 peak, and below the level in 1900 (though that number must be taken with several grains of salt). The public figure is the lowest since 1978, which was at the tail end of a five-year surge in membership; it’s down over 5 points from its 1994 peak.
Though public sector density drifted lower for years after that peak, the slide accelerated after 2011, the year Wisconsin governor Scott Walker launched his war on the state’s public sector unions by allowing members to opt out of membership. Other states followed suit, like Michigan in 2013 and Ohio in 2016. Then, in 2018, in the Janus case, the Supreme Court declared that public sector workers nationwide could not be required to pay union dues. These moves have achieved the desired results, and probably have a lot more to run.
Another bit I’m going to copy–paste from last year (click here and scroll down a screen or two to see the graph):
There’s an old lie that unions are good for white men and no one else. That’s the opposite of the case. As the graph below shows, black women, for example, earn 63% as much per week as white men overall; belonging to a union brings that up to 78%—still a large gap, but a much smaller one. Nonunion Latinas earn 60% as much as white men; a union brings that up to 83%. And, as a team of researchers from the Economic Policy Institute argues, unions can raise the level of nonunion workers if they’re prevalent enough in a geographical area or industrial sector. No wonder employers hate them.
As the map below shows, there are strong geographical patterns to union membership, with organized labor strongest in the Northeast, Upper Midwest, and Pacific Coast, and weakest in the South and Mountain West. At the bottom are the Carolinas, where just over 2% of workers are unionized, a tenth the share of Hawaii and New York, the top states.

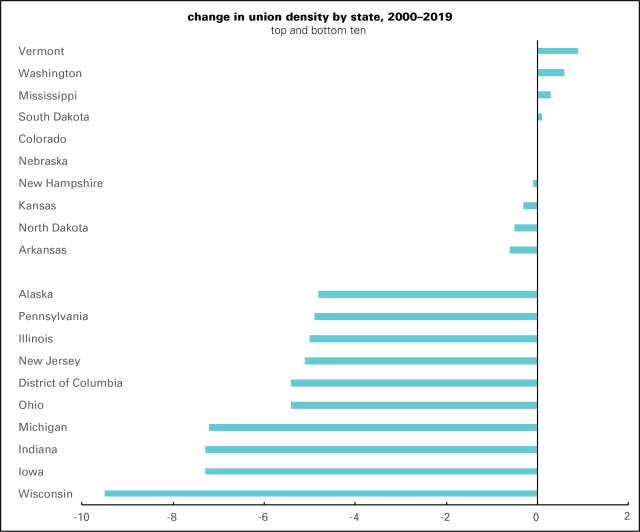
Yearly changes in membership at the state level are pretty noisy, but a longer-term look is revealing (graph below). Only four states saw gains between 2000 and 2019, and those were tiny. Vermont, the champ, was up all of 0.9 percentage point (though that still didn’t reverse the decline between 2015 and 2018). By the time you get to number seven, you’re talking small declines. At the bottom of the ranking, losses were many times larger, with Wisconsin, Michigan, and Ohio among the biggest losers.
And this is more than ten years into an economic expansion, during which the unemployment rate has been under 4% for 18 of the last 20 months. Yes, I know there’s a lot wrong with the job market, but this is about as good as it’s going to get. Come the next recession and the decline is likely to be worse as corporations and governments look to cut costs.
There are a lot of things wrong with American unions. Most organize poorly, if at all. Politically they function mainly as ATMs and free labor pools for the Democratic party without getting much in return. But there’s no way to end the 40-year war on the US working class without getting union membership up, so these density stats are nothing but bad news.
Fresh audio product
Just added to my radio archive (click on date for link):
December 26, 2019 Adam Kotsko, author of “The Evangelical Mind,” on the life and thought of that tendency • Shailja Sharma on India’s new citizenship law and protests against the country’s drift into fascism

