
Fresh audio product
Just added to my radio archive (click on date for link):
November 1, 2018 Amanda Armstrong on the importance of trans politics • Alfredo Saad-Filho on the prospects for Brazil under the fascist Bolsonaro
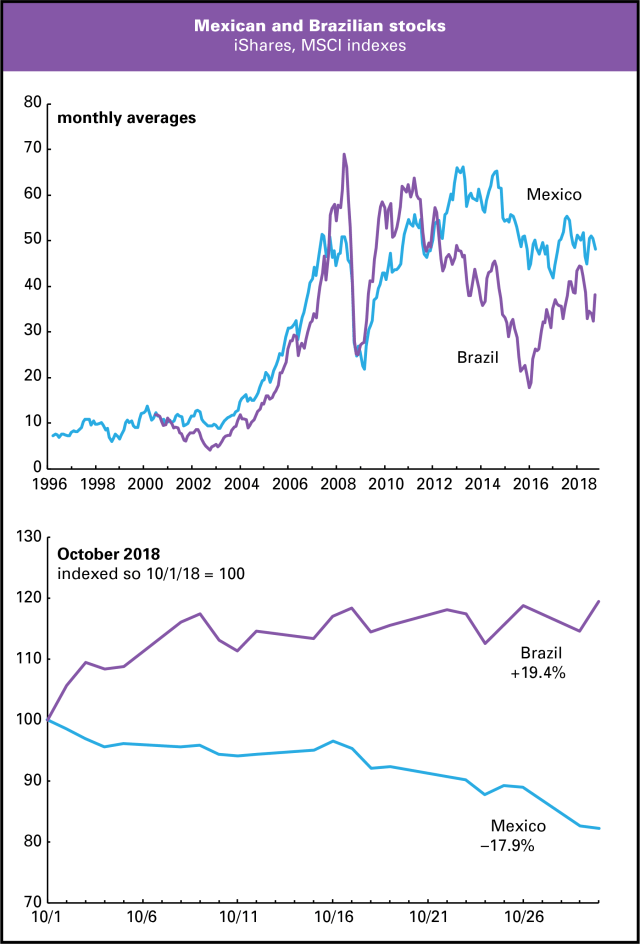
Fascists are good for stocks
Investors are looking forward to the inauguration of the terrifying fascist Jair Bolsonaro as president of Brazil on January 1. And they look to dreading the inauguration of the moderate social democrat Andrés Manuel López Obrador (aka AMLO) as president of Mexico on December 1.
Graphed below are indexes representing the two countries’ stock markets—or, more specifically, shares traded on the New York Stock Exchange designed to mimic those indexes. (The history of the Mexico index is here; of Brazil, here.) The top graph is a long-term view. It shows that the two countries’ stock markets moved pretty much together from the indexes’ inception through 2011. They parted ways in 2011, as Brazil drifted into a profound economic and political crisis. Brazil recovered beginning in early 2016 as Mexico moved sideways.
But the two indexes really began diverging a few weeks ago. AMLO was elected on July 1; Mexican stocks showed little reaction at first. But in recent weeks, as his inauguration came closer, anxiety has set in. By contrast, Bolsonaro won the first round election on October 7, but didn’t get 50% of the vote, requiring a runoff. He won that soundly on October 28. Since from before the first round it was clear Bolsonaro was likely to win, stocks began rising in mid-September, and have continued to rise.
The contrast is stark if you look at just the month of October. Since October 1, Mexican stocks are down 17.9%; Brazil’s are up 19.4%. ALMO promises rather mild reforms, and investors panic. Bolsonaro promises to destroy the left, deploy death squads to “fight crime,” steal resources from indigenous populations, and shower big business with favors, and investors celebrate.
What’s the spilling of blood when there’s money to be made?
Fresh audio product
Just added to my radio archive (click on date for link):
October 25, 2018 Kevin Skerrett, co-editor of The Contradictions of Pension Fund Capitalism, on what they do with all that money and why we don’t need giant pension funds at all • Liza Featherstone and Jane McAlevey on #metoo, one year later, and what can be learned from Hands Off Pants On
Hits to GDP
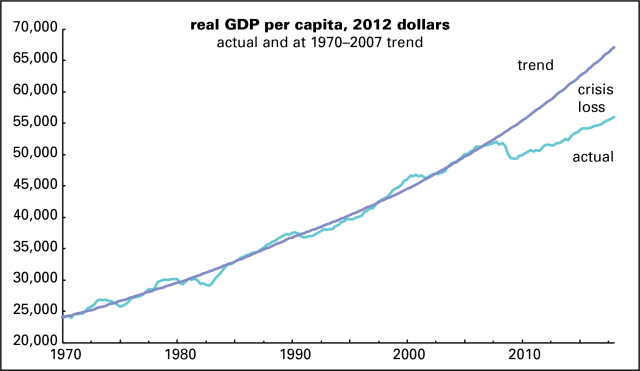
The hysterical (in the funny sense) report on socialism that the Council of Economic Advisers put out this morning contains this gem of simulation:
It may well be that American socialists are envisioning moving our policies to align with those of the Nordic countries in the 1970s, when their policies were more in line with economists’ traditional definition of socialism. We estimate that if the United States were to adopt these policies, its real GDP would decline by at least 19 percent in the long run, or about $11,000 per year for the average person.
Sounds dire—but even if true, and there’s no reason to believe it is—that would be smaller hit than the 2008 financial crisis was, no simulation about it. As the graph below shows, over the long term, actual GDP wandered around its trendline, rising above in booms (1990, 2000) and falling below in busts (1975, 1982). (The trendline assumes constant growth at the average over the period, 3.2% a year.) But the 2008 financial crisis and its sequelae have driven actual GDP well below its previous trend. Had real per capita GDP continued to grow at its 1970–2007 trend rate after the financial crisis, it would be $12,316 higher than it is now.
So a financial crisis is at least 12% worse than Nordic social democracy, without all the benefits.
Fresh audio product
Just added to my radio archive (click on date for link):
October 18, 2018 Leandros Fischer on German politics, with an emphasis on refugees (Jacobin page here) • Samuel Moyn, author of this article, on why the Supreme Court sucks and what can be done about it
Fresh audio product
Just added to my radio archive (click on date for link):
October 11, 2018 Julia Posca on the new right-wing CAQ government in Quebec • Alfredo Saad-Filho on the probable next president of Brazil, the frighteningly right-wing Jair Bolsonaro, and the global strong man phenomenon
Fresh audio product
Just added to my radio archive (click on date for link):
October 4, 2018 Shamus Khan on the culture of entitlement at elite schools (op-ed here) • Thea Riofrancos on the fraying legitimacy of the ruling class and its possibilities for the left
Fresh audio product
Just posted to my radio archive (click on date for link):
September 27, 2018 Anand Giridharadas, author of Winners Take All, on the win–win business- and plutocrat-friendly philanthropy of today’s nouveau riche
Sadly, there is no strike wave
In a September 8 post to the Jacobin website, Eric Dirnbach announced that “US workers are striking again.” In the piece, he discloses:
That’s why it’s fascinating that in 2018, we’re seeing a dramatic increase in the number of large work stoppages. I count sixteen for the first half of the year, including one lockout, which if this trend continues, puts us on track for thirty-two for the full year. The number of large work stoppages has not been thirty or more since the year 2000.
It would be lovely if this were true, but it’s not.
Dirnbach makes it clear in this piece that he doesn’t understand the strike stats at all. (And precision demands noting that the Bureau of Labor Statistics [BLS] calls the series “work stoppages,” because it includes lockouts.) He seems to think the stats are released only annually, but in fact they’re regularly updated and available on the Bureau‘s website.
That data tells us that from January through July (the most recent month available), there were twelve large work stoppages (meaning involving 1,000 workers or more). If that rate is annualized, that would work out to 21 stoppages this year [12/(7/12) = 20.57]. As the top graph below shows, that’s not all that much of a departure from recent experience. That’s just a bit above 2011 and 2012’s 19. It ties 2007’s rate and falls short of 2005’s 22.

And by another measure, the share of workdays of “idleness” (gotta love the Calvinism of labor statisticians)—the number of workdays lost to stoppages (number of strikers times the length of the strike) as a percent of workdays throughout the U.S. economy—is barely off the 0 line, as the second graph shows.
Of course the year isn’t over yet, and anything could happen. But there’s no strike wave underway.
PS: Point of personal privilege—the article uses the lbo-news graph of union density from this article without credit. That’s not nice.
PPS: The Jacobin version was a reprint of a July Medium post. At least that version offered proper credit for the graph.
Fresh audio product
Just added to my radio archive (click on date for link):
August 30, 2018 Raven Rakia, a journalist with The Appeal, on the nationwide prison strike (more here and here) • Asad Haider, author of Mistaken Identity, on race and class
[the source of the info on the Shostakovich quartet is here]
Fresh audio product
Just added to my radio archive:
August 23, 2018 Rob Larson, author of Capitalism vs. Freedom, explores how the “free market” is a realm of unfreedom, and Keith Gessen discusses his new novel about contemporary Russia, A Terrible Country
Fresh audio product
Just added to my radio archive (click on date for link):
August 16, 2018 Christina Gerhardt, author of Screening the Red Army Faction, on the RAF’s history and artistic reception in the context of the German 1960s and 1970s
Fresh audio product
Just added to my radio archive (click on date for link):
August 2, 2018 Adam Tooze and Leo Panitch, separately, on globalization, Trump, the American empire, declinism, etc.


Leave a Comment
Posted on October 8, 2018 by Doug Henwood
Expropriate Yale
Here’s what I said before and after my interview with Shamus Khan about elite schools on my October 4 radio show. Someone on Twitter asked me to post the comments, and here they are.
First, elite schools. I have some personal experience with them. I grew up in a mediocre suburb in northern New Jersey and went to mediocre public schools. But since I did all the things you’re supposed to do, I got admitted to Yale in 1971 and spent four years there. It was quite a shock to me to confront all those generations of institutional power—Yale was then 270 years old—and a stratum of people I barely knew existed, preppies. People like me had only begun going to Yale in the early 1970s; starting in the late 1960s, under the admissions director R. Inslee Clark, known in classic WASP style as “Inky,” the university began admitting middle class kids from public schools, and women as well. (A few years ago, Clark was revealed to be part of a ring of sexual predators at the Horace Mann School in the Bronx during the 1970s and 1980s.) The legacies, those whose fathers and grandfathers went to Yale and whose names sometimes appeared on buildings, were still there in quantity, but the days when Yale and the other Ivies were mere finishing schools for rich young men were over. They became much more meritocratic (a problematic word worth a show in itself) institutions for ruling class recruitment.
As part of that molding of future leaders, a word such institutions like, places like Yale inculcate the sense, if you weren’t already born into it, that the world is yours for the taking. That attitude came into gross public view with Brett Kavanaugh’s confirmation hearings. My first guest, Shamus Khan, had an op-ed in the Washington Post about that culture. Khan is the author of a book about a prep school he was both student and teacher at called Privilege: The Making of an Adolescent Elite at St. Paul’s School, published by Princeton University Press in 2013. He’s also chair of the sociology department at Columbia. Shamus Khan.
The tales of Kavanaugh’s time as a member of DKE, the gross fraternity, reminded me of the only guy I knew who was a member. Frats had almost died at Yale in the early 1970s; the culture of the 1960s undermined them—though sadly not fatally since they underwent something of a revival during the Reagan years. The major undergraduate achievement of the DKE guy I knew was throwing a burning couch out of his dorm window while quite drunk. That’s Brett Kavanaugh’s set.
I had a great time at Yale, I must say, but it should not exist. It’s too rich, and it is mainly an instrument of ruling class reproduction. Expropriate it, I say, and give the money to broke public universities.
Share this: