
Fresh audio product
Just added to my radio archive (click on date for link):
June 28, 2018 Leo Panitch on Doug Ford, Ontario’s Trump • Cordelia Fine, author of Testosterone Rex, dispenses with all the nonsense about biological differences between the sexes (back after two-week hiatus because of a major writing deadline)
Contingency: a last word
Having refuted (here, here, and here) a lot of folk wisdom about increased volatility in the job market, I’d to file a postscript on the meaning of it all. The folk wisdom exaggerates the prevalence of contingent and temporary work, but that doesn’t mean the working class is living in ease and comfort. It’s not.
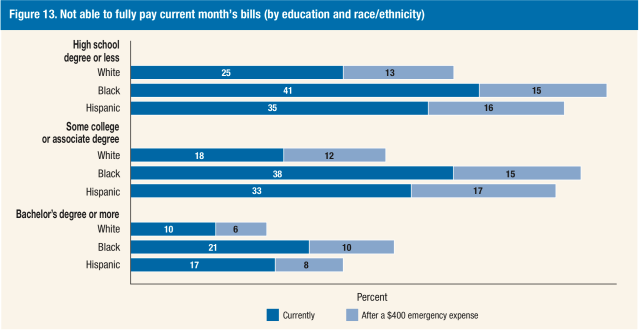
For evidence we can turn to a very orthodox source—the Federal Reserve’s survey of economic well-being (and data appendix). A third of respondents, 33%, report themselves “living comfortably”; 40% are “doing okay,” 19% are “just getting by,” and 7% are “finding it difficult to get by.” Given people’s predilections toward giving upbeat answers, these are not impressive figures. Just 42% “always” or “often” have money left over at the end of the month. Almost half—47%—owe money on their credit cards; 29% report their credit card debt growing, and only 20% have paid any of it off. Over half, 51%, always or frequently make only the minimum payment. Almost a quarter, 22%, wouldn’t be able to pay their bills in the month the survey was taken. (There are large demographic disparities in that count: 25% of whites with a high school degree or less fall into that category—not all that much more than the 21% of blacks with bachelor’s degrees or more. See graphic below.) Half have less than $100,000 saved for retirement; 20%, less than $10,000. Almost one in ten, 9%, received food stamps in the previous year. Well over half, 57%, could not cover their regular living expenses should they lose their job with saving or even borrowing. Half couldn’t cover an emergency expense of $400 without borrowing or selling something. One in ten had to forego a doctor visit or skip on prescription drugs because they lacked the money; one in five skipped visits to the dentist. All together, about a quarter skipped some form of medical care because they couldn’t pay. Over a third, 37%, have some form of lingering medical debt that wasn’t covered by insurance.
The Fed assembled responses into measures of financial well-being. They found that 42% of Americans have a “high likelihood of material hardship”: 38% of whites, 46% of blacks, and 52% of Hispanics/Latinos.
While most of these measures have improved over the last few years as the Great Recession recedes into the past, they’re still awfully high. And because most people have so little in the way of savings, and because our welfare state is so brutally minimal, even a modest shock like an illness or a temporary spate of unemployment can throw people who thought they were solidly middle-income into penury and despair. (A striking example: in the 1970s, about two-thirds of the unemployed were collecting unemployment insurance benefits, a minimal standard of decency; that’s now down to about a third.) And this doesn’t even address the level of stress—visible in soaring antidepressant and opioid use and sagging life expectancy—that the increased competitiveness of the neoliberal era routinely produces, even among the employed.
So while the gig economy is mostly a fantasy produced by publicists (and leftists who take the publicity too seriously), there’s plenty of entirely preventable economic misery around.
Contingency: a follow-up
My post on contingent and “alternative” work (and the demographic follow-up) annoyed some people who think the Bureau of Labor Statistics, the source of the data, is missing the point through bad definitions and bad techniques. (As am I, for using it.) According to these critics, asking people whether they expect their jobs to last the year is using the wrong definition of contingency—though it’s not clear what the right one is, since most employed people in the U.S. can be fired for no reason at all at any time. Or the BLS was wrong to focus only on the primary job; plenty of people do gig work on the side to supplement their incomes, so the Bureau is—perhaps intentionally!—lowballing the numbers. Yes, though we don’t know how many such people there are (though we’ll know more when the BLS releases its data on “individuals who found short tasks or jobs through a mobile app or website and were paid through the same app or website” on September 30). But the side hustle is a different story from the canonical gig economy line, which is that we’re all day laborers now. Or, best criticism of all, the numbers are just wrong because they don’t comport with my correspondents’ experience. But you don’t know how representative your experience is, do you?
Here are some stats to address these counterclaims.
job tenure
The gig economy story is closely related to idea that the permanent job is a thing of the past—we all bounce from job to job now. That perception is not confirmed by the BLS’s job tenure numbers, which report the median number of years people have been in their current position. Here’s what it those look like like broken down by sex.
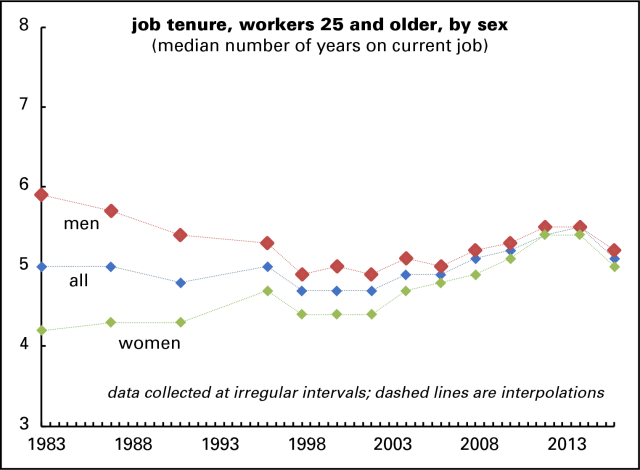
Median tenure has bounced around some but the lines are surprisingly trendless, given the chatter about increased volatility. Tenure overall barely changed between 1998 and 2016; it fell by about a year through 1980s and 1990s and rose since; it was about one month longer in 2016 than it was in 1983. That average does obscure some gender differences. Tenure for men fell by a year between 1983 and 1998, rose by half a year through 2014, and then fell a bit between then and 2016, to a level about eight months shorter than 1983. Tenure for women, however, has been rising fairly steadily; it rose about ten months between 1983 and 2016.
There’s not all that much change in tenure by age or industry either. For younger workers, those between 25 and 34, tenure fell by three to four months between 1983 and 2016, with not much variation in the intervening years. By industry, tenure rose by two years between 1983 and 2016 in construction, fell by a month or two in manufacturing, and has risen across most intervals in retail trade and finance. Tenure in government was up by nearly two years between 1983 and 2016. Of course 1983 was not 1963, the Golden Age before everything reportedly went haywire in the 1970s. But 1983 was very early in the neoliberal era, so we should expect to see more of a change than we have.
churn
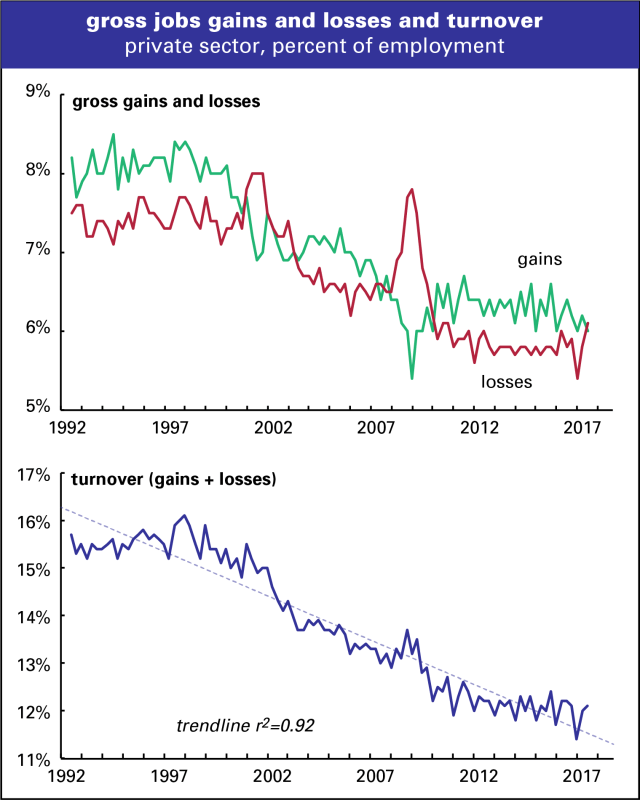
Another counter to the job-churning story: turnover now is lower now than it was in the early 1990s. The monthly employment numbers—like “employers added 223,000 jobs in May”—are net figures, and are the difference between many gross job gains and losses. At current rates, that 223,000 figure probably results from something like 2.5 million gross gains, from new and existing employers, and 2.3 million losses, from shrinking firms or ones that go under. (We won’t know the actual numbers for many months yet—these are just guesses from recent trends.) Add the gross gains and losses together and you get figures on gross turnover—almost 5 million jobs come and go in a typical month lately.
Here’s what those gross numbers look like (translated into percentages of employment to make them comparable over time). All are down considerably from the 1990s. The trendline in the turnover graph heads steadily down; the r2 figure of 0.92 means that the trend alone explains 92% of the movement in the series. That’s not to say time is causing the downtrend; it is to say it’s very well-established.
part-time work
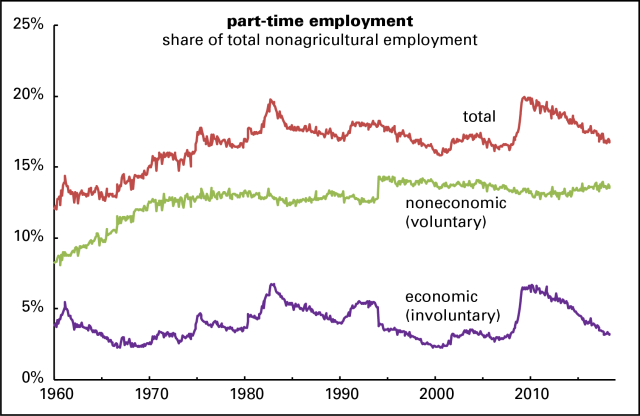
Another claim: we’re all juggling multiple part-time jobs, or working short hours because full-time employment isn’t available. There has been little change in the share of part-time employment in the total since the early 1980s. It was around 17% of the total in 1980, and is around 17% today. Part-time employment comes in two measures: noneconomic or voluntary (people who prefer part-time work), and economic or involuntary (people who want full-time work but can’t find it). Noneconomic is essentially trendless since 1975. Economic is highly cyclical, rising in recessions, and falling in expansions. It’s now at or below the lows of the late 1970s and late 1980s. It’s slightly above where it was in 2000, a serious boom year. (There were definitional and technical changes in the survey on which these numbers are based in 1994; they took the economic share down by 1.1. Instead of inferring whether part-time workers wanted full-time, as had been the case earlier, surveyors began explicitly asking if respondents want full-time work, a not-unfair question but one that yields smaller numbers. There have been no significant changes in the survey since then.)
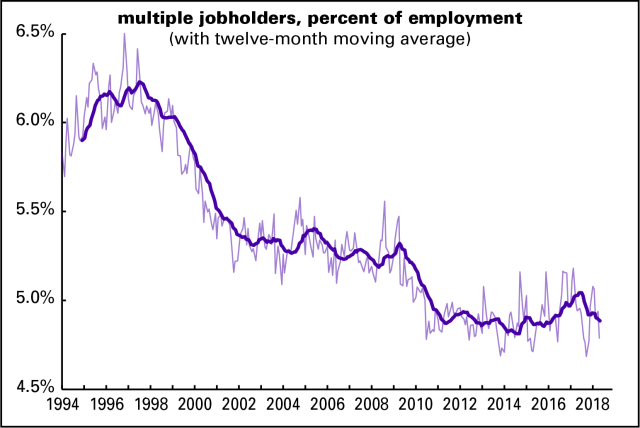
multiple jobs
Ok, maybe gig work isn’t the norm, but lots of people are doing it on the side, right? Maybe, but you’d have to find some fresh numbers to support that case. Here’s the share of multiple jobholders. It declined from 1998 through 2011 and has been flat since. Lately less than 5% of the employed have been working more than one job. We’ve only got 24 years of this data, so it’s hard to make generalizations about it, but it looks like multiple jobholding rises early in an expansion and falls later as the labor market tightens.
temp work
There has been no uptrend in temp employment in almost 20 years. There was a sustained rise from when the stats on temporary help firms (then called “help supply” in BLS argot) begin 1982 through 1998, but the trend has been flat since. Temp employment fell sharply in the Great Recession, and somewhat less in the early-2000s downturn, and rose after both to the 2% neighborhood. Temp firms accounted for 2% of employment in May 2018, exactly what they did in October 1999.

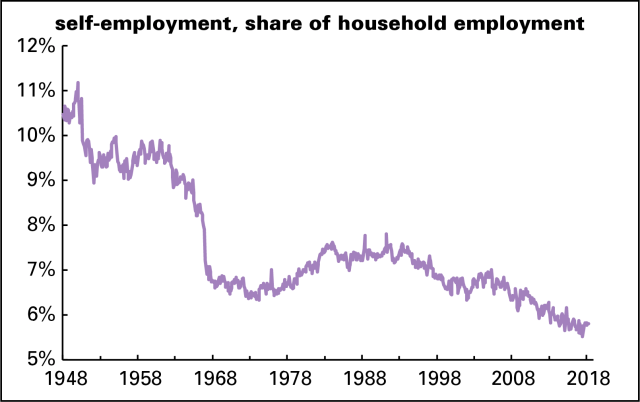
self-employment
If a growing horde of us were 1099ers (disclosure alert: I’m one), then you might think the count of the self-employed would reflect it. But they’re not showing up in the BLS’s monthly employment numbers (which they compile by asking 60,000 people lots of questions every month). Self-employment has been declining as a share of the total for almost 70 years, with the exception of a mild rise in the 1970s and 1980s. Yes, this is also about people’s main job; there may be more freelancing to pick up extra cash. But these numbers offer no support for claims that the traditional job is disappearing.
As I said at the end of the first contingency post, none of this is to say that the world of work is pleasant or secure. Much of the population works hard and still can’t make ends meet. Except at the top, wages have been stagnant for decades and benefits are disappearing. But the stories of a new precarity are grossly overdone. You have to wonder that they gain salience because they’re written by academics and journalists, two fields where contingent employment seems more prominent than in other fields. But precarity has been the condition of the working class since the beginning of capitalism. That’s a major reason why it’s a bad system and should be replaced.
Contingency: almost every demographic is down
Someone on Twitter, reacting to my last post on contingent employment, wrote this:
“Contingent workers were more than twice as likely as noncontingent workers to be under age 25.” Profitable corporations are putting lots of young people in incredibly exploitative jobs and making it normal. For the young work is a new hell, and it’s not temporary.
Workers under the age of 25 are less likely to be contingent than they were 22 years ago. Here’s the detail by demographic group.
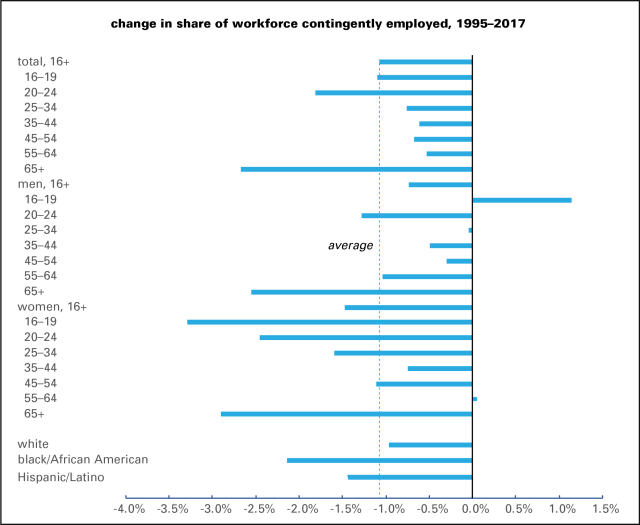
The share for workers in the 20–25 age group declined more than the average—especially women. The only groups to see an increase in share were teenage males and, barely, women aged 55–64.
This is not to say that young workers—or any workers except the professional/managerial elite—have a great thing going. But our critique should be about wages, benefits, working conditions, and our savage lack of a basic welfare state, not about “precarity.”
No it’s not a gig economy
Despite the voluble testimony of pundits and bar companions, the world of work is not one of Uber drivers and temp workers. In fact, the share of U.S. employment accounted for by contingent and “alternative” arrangements is lower now than it was in 2005 and 1995.
That testimony is derived from several original sources. For example, a much ballyhooed 2014 study commissioned by the Freelancers Union—which is not a materially disinterested party—reported that a third of workers are freelancers. The claim of a 2016 paper by Lawrence Katz and Alan Krueger that “all of the net employment growth in the U.S. economy from 2005 to 2015 appears to have occurred in alternative work arrangements” was widely quoted and quickly became folk wisdom. That paper was based on an online survey conducted by the RAND Corporation The survey was small—fewer than 4,000 respondents—and its sample wasn’t very representative of the overall population, a flaw the authors corrected through vigorous statistical handiwork.
Data released this morning by the Bureau of Labor Statistics should put an end to this chatter. According to a special edition of their Current Population Survey, a monthly poll of 60,000 households conducted jointly with the Census Bureau, just 3.8% of workers were classed as contingent in May 2017, meaning they don’t expect their job to last a year. That’s down from 4.1% in 2005 and 4.9% in 1995. (Reports from the years before 2017 are here.) Tighter definitions show smaller shares, but also down from earlier years. In 2017, 96.2% of workers were noncontingent, compared with 95.1% 22 years earlier.
The share of workers in “alternative” arrangements was 10.1%. Of those, 6.9% were independent contractors, 1.7% were on-call, and 1.5% were employed by either temp or contract firms. That means that 89.9% of the workforce has a “traditional” job, down 0.2 point from 1995.
There’s less of a racial pattern to contingency than one might guess: 3.7% of white workers don’t expect their jobs to last, compared to 4.0% of black workers; 4.9% of Asian, and 5.1% of “Hispanic/Latino.” All these shares are down from 1995. Nor is there a vast gender disparity: 3.9% of women, vs. 3.8% of men are contingent.
And not all independent contractors are freelancers hanging on by a thread: 39% are in managerial or professional occupations, slightly less than their share of the overall workforce. These would include self-employed doctors or consultants. Reflecting that, independent contractors are more likely to be white and male than nonwhite non-men. Other forms of alternative arrangements show surprisingly little variation by race and gender; nonwhites are more likely to be temp workers, but there’s no gender gap at all. Almost all demographic groups show little change from 1995, and most of those changes are downward.
Of course, not all contingent workers are consultants or contract programmers. Full-time contingent workers earn 77% as much as noncontingent workers; contingent part-timers earn 89% as much as noncontingent part-timers.. Almost three-quarters—73%—have some kind of employer-provided health insurance, compared to 84% of noncontingents. All in all, 55% of contingent workers would like a traditional job.
“Alternative” workers are better off. Full-time independent contractors make 96% as much as noncontingent full-timers; contract workers (heavily used in tech) make 22% more. Temp workers—0.9% of the workforce—are much worse off, however, making 41% less than the traditionally employed. About three-quarters of independent contractors have employer-provided health insurance, but only two-thirds of temp workers do.
None of this is to argue that the world of work is a delight. But we should be clear about what the problems are. Precarity isn’t the major problem in the American labor market. It’s that wages are stagnant or worse, benefits are eroding, and much labor is dull, alienating, pointless, and sometimes dangerous. Many people with normal, full-time jobs have a hard time making ends meet, and most households have little or no savings to fall back on in a crisis. Emphasizing precarity only makes workers feel even more powerless than they are.
Fresh audio product
Just added to my radio archive (click on date for link):
June 7, 2018 Adam Gaffney (see link for articles) on how to get prescription drug prices down • Barry Eichengreen, author of The Populist Temptation, on the nationalist/xenophobic turn (Trump, Brexit, etc.), and on the future of the U.S. dollar
Fresh audio product
Just added to my radio archive (click on date for link):
May 31, 2018 Kali Akuno of Cooperation Jackson on why black Americans should resist gun control • Sabri Oncu on Turkey—the currency panic, the political and economic troubles
Fresh audio product
Just added to my radio archive (click on date for link):
May 24, 2018 Richard Walker, author of Pictures of a Gone City, on what the tech boom has done to the Bay Area
Fresh audio product
Just added to my radio archive (click on date for link):
May 10, 2018 Christy Thornton on AMLO and Mexico’s July elections • Richard Florida on the spatial dimensions of inequality
Fresh audio product
Just posted to my radio archive (with a few days’ delay—sorry!). Click on date for link:
May 3, 2018 Alejandro Velasco on Venezuela • Jessica Blatt, author of Race and the Making of American Political Science, on the racist origins of the discipline
Fresh audio product
Just added to my radio archive (click on date for link):
April 26, 2018 Corey Pein, author of Live Work Work Work Die, on the dark side of the Silicon Valley • an anonymous sex worker on the legal dangers of SESTA/FOSTA
Fresh audio product
Just added to my radio archive (click on date for link):
April 5, 2018 Sean Jacobs, founder of Africa Is A Country, on Winnie Mandela’s legacy • Forrest Hylton on Colombian politics in the run-up to May’s presidential election

