Student debt up, all other kinds down
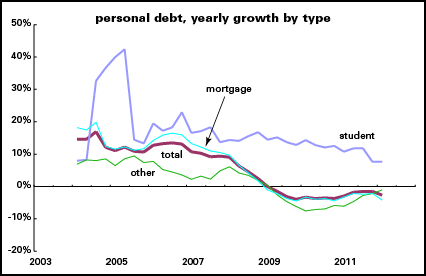
The New York Fed is out with its credit report for the first quarter of 2012. It shows student debt bucking the trend (“Student Loan Debt Continues to Grow”), rising while all other kinds of debt fell from the end of last year. Student debt, at $904 billion (not yet the much-advertised trillion), is now considerably larger than credit card and auto debt. A decade ago, student debt was a less than half credit cards and autos.
(By the way, it’s interesting that the New York Fed has begun publishing rigorous student debt estimates, which were previously unavailable. Mark Kantrowitz’ estimate of over $1 trillion on his Student Loan Debt Clock is widely cited, but he doesn’t disclose his methods, even when asked. The New York Fed contracted with Equifax, the credit-rating agency, to get good numbers. The central bankers recently had David Graeber, author of Debt: The First 5,000 Years, down to talk to them, where he told them about the need for debt relief. He reports that they were very receptive to his message, fearing another economic crisis if nothing is done, though they probably wouldn’t go as far as his call for a Jubilee-style writeoff. It is utterly fascinating that this Vatican of capital called a prominent anarchist intellectual in for a consultation.)
For the quarter, student debt rose by $30 billion, or 3.4%, while all other kinds of debt fell by $131 billion, or 1.2%. Of the other major categories, only auto debt was up (but just 0.3%); mortgages (-1.0%), credit cards (-3.6%), and home equity lines (-2.4%) all fell. Debt has broadly been falling for almost four years, but student debt continues to rise. Nonstudent debt is down 13% from its 2008 peak—but student debt makes a new peak every quarter.
The best way to measure personal debt burdens over time is by comparing them to after-tax incomes. As the graph shows, most forms of debt rose steadily from 2003 (when the New York Fed data begins) through a peak at the end of 2007, and have fallen dramatically since. But not student debt. In fact, the ratio of nonstudent debt to income is only a little higher than it was in 2003—but the student debt ratio has more than doubled (from 2.9% to 7.9%). And that’s relative to aggregate incomes. Student debtors skew young, and their cohort’s incomes are well below average (even more so these days), meaning that the relative burden has risen more sharply than it looks.
As the student debt burden rises, it’s harder for debtors to pay. Delinquency rates, though down from their 2010 peaks, are well above all other kinds of debt. And student debt was the only category to show an increase in delinquencies last quarter. (Funny word, “delinquency.”) Officially, 8.7% of student loans are delinquent, but since many debtors are still in grace periods, they’re not expected to pay. Of those that are, the New York Fed earlier estimated that 27% of debtors were behind on their payments, when the official number was lower than last quarter’s. (See my earlier write-up of this topic for more.) This is an extraordinary level of financial distress.
As I’ve said elsewhere (“How much does college cost, and why?”), it would be fairly easy to make higher ed completely free in the U.S. But that’s not the way we do things here. Debt is too useful as social discipline.


What’s wrong with calling falling debt “deleveraging?” Another interesting fact about the New York Fed: Jamie Dimon sits on the board.
Pingback: Student Debt Rises | Stacked on the floor
Pingback: Saturday Bonus Round – Extra Crazy News « The News Makes Me Crazy
Pingback: Sunday Reading « zunguzungu
you don’t say it but surely the difference with this kind of debt is it is taken on in the belief/fantasy that one will be able to make more money later because of it – and therefore avoid more of it. the category ‘debt’ is uncommunicative – different meanings are erased (you will say this is a typical anthropological comment).
Student debt is a problem, no doubt, but isn’t it counter-cyclical? People who have lost of are unable to get a job, i.e., the people most likely to need loans, go back to school to gain skills in anticipation of the recovery. Student debt is seen as much more of an investment than credit card or even mortgage debt (at least after a housing bubble). Meanwhile, state revenue drops in a recession, and states are constitutionally required to to balance their budgets, and cuts to public university funding is nearly forced. What does the debt growth graph look like if you include previous recessions?
Pingback: Thoughts on transition: Public education, social justice, and geography | AntipodeFoundation.org
Pingback: The crushing burden of student debt « Phil Ebersole's Blog