Biden by 20
Based on historical patterns going back to 1948, Biden should beat Trump by almost 20 points in the popular vote. Of course, if anyone could blow this, it would be Biden.
Back in 1996, when I was still doing Left Business Observer, I came across a 1993 paper by Andrew Gelman and Gary King, “Why are American Presidential Election Campaign Polls so Variable when Votes are so Predictable?” It cited research showing that despite all the volatility in the opinion polls during the campaign, the results were fairly easy to foresee months in advance based on some fairly simple models.
Inspired by that paper, I developed my own version of such a model—and, given my statistical skills, it had to be a very simple model. It had just two inputs: the president’s approval rating and the yearly growth in real after-tax income per capita (aka disposable personal income, or DPI), both measured in the second quarter of the year before the election. It all worked surprisingly well. I’ve updated it a few times over the years with subsequent elections, and just ran the numbers for 2020, which is where the prediction of a Biden landslide comes from.
A few more details. The model predicts the share of the popular vote that “should” be earned by the incumbent party (which may or may not be an incumbent person) and by the challenging party. What’s shown below is the difference between the two, actual and as predicted by the model.
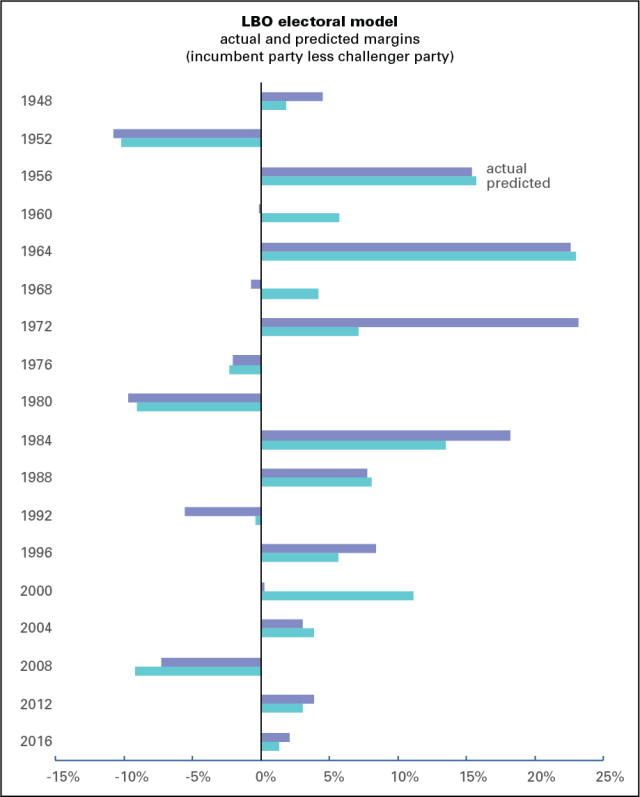
While it was sometimes off on the margins—though, all things considered, it’s pretty good—it still predicted the correct result in 16 of the 18 cases. The only ones it got wrong were 1960 (in which there were suspicions, never proven, of vote fraud to Kennedy’s benefit and Nixon’s detriment) and 1968, when the wily Nixon got his revenge by beating the hapless Humphrey.
At the bottom of this page is the history of the inputs and results. Approval is average Gallup approval rating for the president from April through June of the election year (which isn’t necessarily the approval for the candidate: for example, the 1960 approval is Eisenhower’s in the spring of that year, not Nixon’s); DPI is the yearly growth in after-tax income per capita for the second quarter, from the national income accounts; and margin is the difference between the incumbent party’s share of the popular vote and the challenger’s. The equations are shown at the bottom. As I said, it’s a simple model.
For 2020, I’ve used Trump’s current Gallup approval rating and an estimate of an 8% decline in real DPI per capita from a year earlier. Since the New York Fed’s GDP tracker is predicting an almost 11% decline for the quarter so far, -8% is a conservative estimate. It shows Biden beating Trump by close to 20 points, or a 60/40 popular vote. At 0%, which is virtually impossible, it still would have Biden winning by over 4 points.
I should attach some consumer warnings here. The model predicts the popular vote, so it called Gore the winner in 2000 and Clinton in 2016 (which, if we had a sane electoral system, they would have been). And 2020 is a completely wacko political year, featuring a lifeless challenger to a mad incumbent in the midst of a pandemic-induced economic crisis. But the conclusion here is that no matter how things look now, if we have an election, it’s Biden’s to lose, a formulation that admittedly may inspire more doubt than confidence in the prediction.
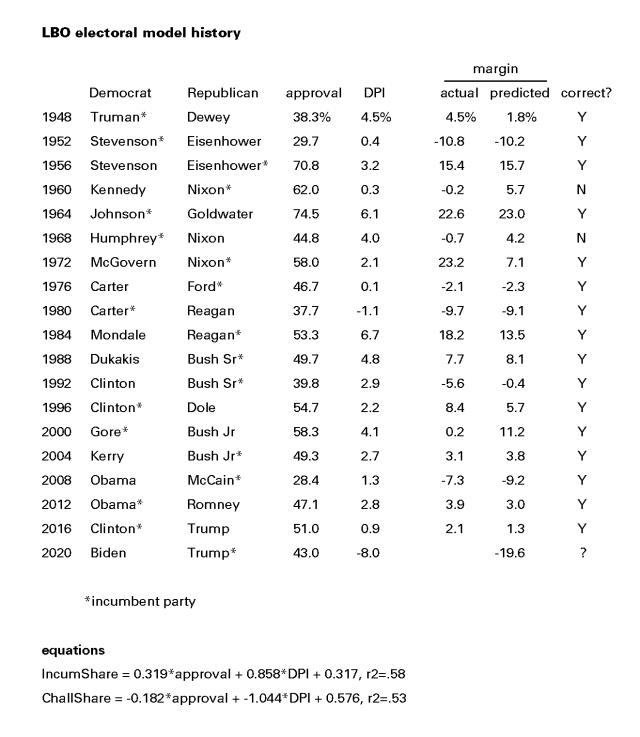
[Apologies that the table is a graphic and not text; WordPress is not table-friendly.]

