Striketober wasn’t
As marvelous as it would be to see a revival of labor militancy, people got a little ahead of things calling last month “Striketober.” According to Bureau of Labor Statistics (BLS) stats, it was a blip by historical standards.
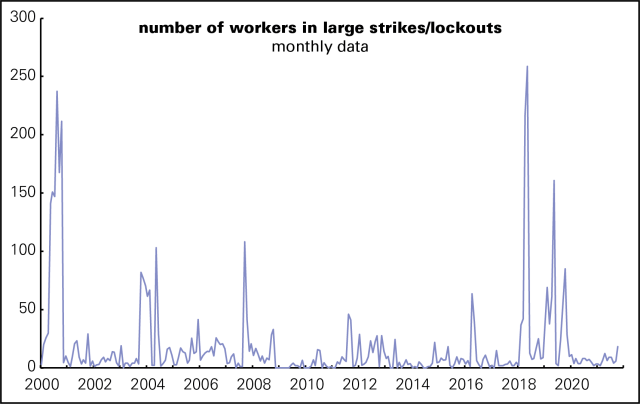
Here’s a graph of the number of workers involved in strikes or lockouts (the BLS counts them together) since 2000. There were 57 months with higher numbers of workers off the job. At the high point of this graph, May 2018, there were over fourteen times as many workers on strike as there were last month.
Here’s another measurement—what the BLS, in nice Victorian fashion, calls “days of idleness” as a percent of total days worked throughout the economy. It was 0.01% in October, a level that’s been matched in 39 other months since January 2000. And as the bottom graph shows, back in the old days when strikes were frequent, lost workdays were many times 0.01%. Before 1980, the low was 0.07%, set in 1957. From 1948 to 1979, it averaged 0.16%. In 1959, just two years after the pre-neoliberal era low, it was 0.43%, the series high.
People criticize the BLS data because it covers only large strikes, those involving over 1,000 workers or more. The government used to publish data on smaller strikes, but it looks to have disappeared from the Federal Mediation and Conciliation Service’s website after not having been updated for years (and it was always in a very user-unfriendly format). But when I looked at what data there was in 2018, it showed the same pattern of decline as the large strike data.
There’s certainly some promising labor agitation going on, like efforts to organize Amazon and Starbucks, and there’s plenty of atomized discontent floating around. But there’s no strike wave yet.


