Productivity stinker
In yesterday’s post about chronically low levels of investment, I concluded that they’ve “given us stagnant productivity growth and a collapsing infrastructure.” This morning, the Bureau of Labor Statistics (BLS) confirmed the productivity part. For the year ending in the second quarter, it was down 2.5%, the worst in the series’ 75-year history.
Productivity sounds like one of those things only the orthodox worry about, but it doesn’t have to be. Its most common form, labor productivity, is a measure of how much a worker can produce in an hour on the job. While that sounds conceptually simple, measuring output is no simple task; few of us are producing “widgets,” that discrete, standardized, and mythical commodity beloved of the homilies in economics textbooks. The standard way of measuring output is its “real” (inflation-adjusted) dollar value (or whatever your national currency is). That may seem like a bit of a kludge, but that’s capitalism for you—it is all ultimately about monetary values.
Output is one thing; how the proceeds of that output are divided are entirely another. Some go to wages, some go to the boss, some go to the shareholders. Over the last couple of decades, the share going to the worker has declined, from about 65% of value-added in the 1960s to around 60% today. But however those proceeds are divided, their growth puts an upper limit on the growth in incomes and with them, material well-being.
Here’s a graph of the history of productivity growth for all nonfarm businesses in the US. Since the quarter-to-quarter numbers can be very volatile, I’ve added a trendline (of the Hodrick-Prescott variety—it’s been criticized as imperfect but what isn’t in this fallen world?).
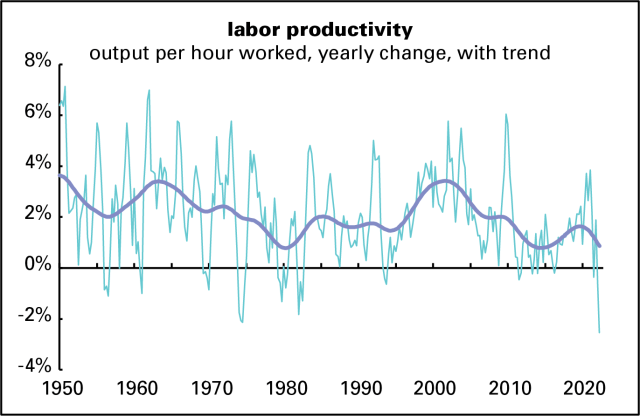
It looks awful, though the downdraft in the trendline may be partly exaggerated by the record-low reading for the most recent quarter. But if that trendline is approximately right, then the current situation is echoing that of the 1970s, a time of falling real wages and rising inflation. (Sound familiar?)
Real wage growth has been terrible lately. According to the measure published in the monthly employment reports, which excludes fringe benefits, the hourly wage has lost over 5% of its value since December 2020. The compensation measure reported along with these productivity members includes fringes, and has lost about half that much over the same period. In any case, it’s striking that in what is by most measures the tightest labor market in decades, a situation that is suppose to enhance labor’s bargaining power with capital, we’re seeing real wage declines. To put that in perspective, here’s a full history of this compensation measure. It looks awful too.
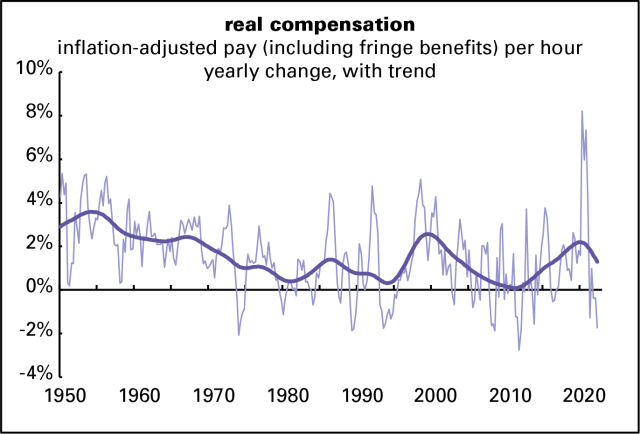
The spike in 2020 is the result not of pandemic-induced wage increases, but the job losses, both temporary and permanent, experienced by low-wage workers in food service and retail in the early lockdown phase. That drove up the average wage. As that was reversed, the average was dragged down. Those disruptions are now largely complete and the measure is back to reflecting reality (as well as any average can).
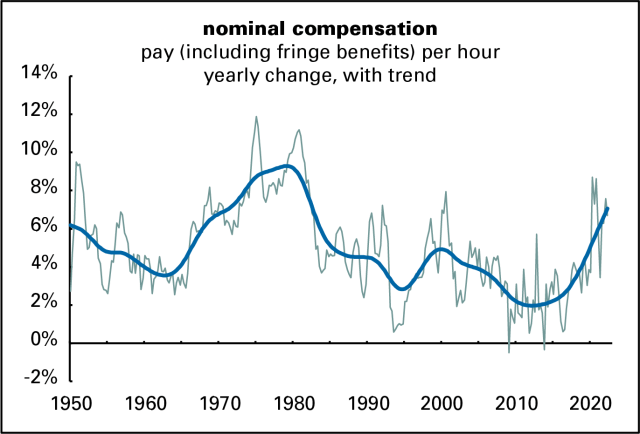
But a lot of this wage story, especially recently, is driven by inflation. Here’s a history of nominal (not adjusted for inflation) hourly compensation. Like the 1970s, the strong nominal wage gains of the last couple of years have been entirely eaten up by inflation.
As a result of strong nominal wage gains and weak productivity growth, unit labor costs—the wage costs of producing a unit of output—have been rising. Again, the only precedent for recent experience is the high-inflation years of the 1970s.
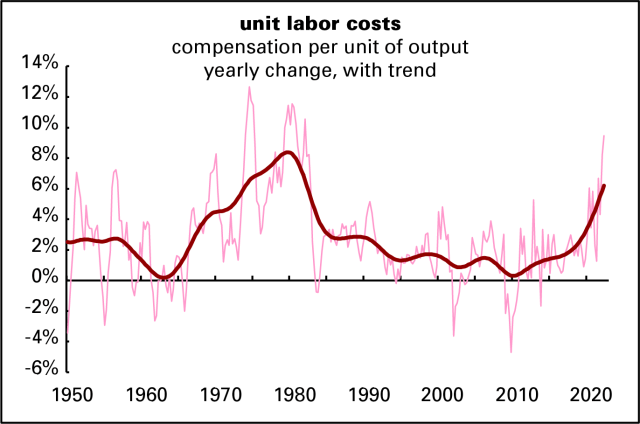
Rising unit labor costs are generally a prescription for sustained inflation. And the idea, common in some precincts of the left, that inflation is a concern mainly of the rich has no basis in fact. Rich people have been doing fine of late, while middle- and lower-income households are struggling to pay for basics.
But instead of blaming greedy workers for the inflation, as a reactionary might, I want to blame low levels of investment. For evidence, look at what happened in the late 1990s. The graphs in yesterday’s investment post show a rise in net investment in the 1990s—from 1992 to 2000, to be precise. These graphs show a sustained acceleration in both productivity and real wage growth over roughly that period—and no rise in unit labor costs. But it was the byproduct of the dot.com bubble, when for a brief time Wall Street welcomed high levels of real investment. When the bubble burst, so did financiers’ interest in boosting capital spending.
Perhaps these are just pandemic disruptions that will peter out over time. But it does seem like the management of Corporate America, and especially its shareholders, have embraced the low-investment, low-productivity model. And the payoff from that is riches for them and high inflation and declining real wages for the rest. Standard austerity programs—fiscal and monetary tightening leading to recession and unemployment—won’t address the underlying problem. An austerity program could lower inflation, but it’s not going to bring about mass prosperity. For that we need higher investment of a sort the system seems incapable of producing.

