More on union density
A couple of follow-up points to Thursday’s post on falling union density.
manufacturing leads the way down
Headline figures on private sector union density (the share of the employed belonging to unions) obscure an important fact: the downtrend is largely a story of the decline in manufacturing. Over four-fifths—88% to be precise—of the fall in the number of unionized workers since 1983 is accounted for by the loss of union jobs in manufacturing. Since 2000, it’s 84%. The history is graphed below.

The raw numbers are stunning. From 1983 to 2022, private employment grew by 49.1 million, but union membership fell by 4.7 million. Of that 4.7 million decline, 4.2 million were in manufacturing. Over the same period, private sector employment outside manufacturing grew by 53.6 million, and union membership there declined by 546,000.
If union density is ever going to turn around, it’s going to have to happen in services. Manufacturing has shrunk from 27% of private employment in 1983 to 12% today. It’s subject to harsh international competition and easily offshored (though maybe not as easily as in pre-covid times). Services are largely shielded from international competition and are not as easily moved. Of course, it’s a lot easier for me to type those words than it is to make it happen.
union advantage
There’s a good reason employers hate unions: they make employment more secure and raise wages. On the security issue, to take one example, as I noted in Thursday’s post, a smaller share of union workers were laid off in the early covid days than nonunion workers. More generally, it’s much harder for bosses to fire unionized workers than nonunionized ones on a whim (and under the doctrine of at-will employment, which prevails in most states, bosses can indeed fire workers on a whim).
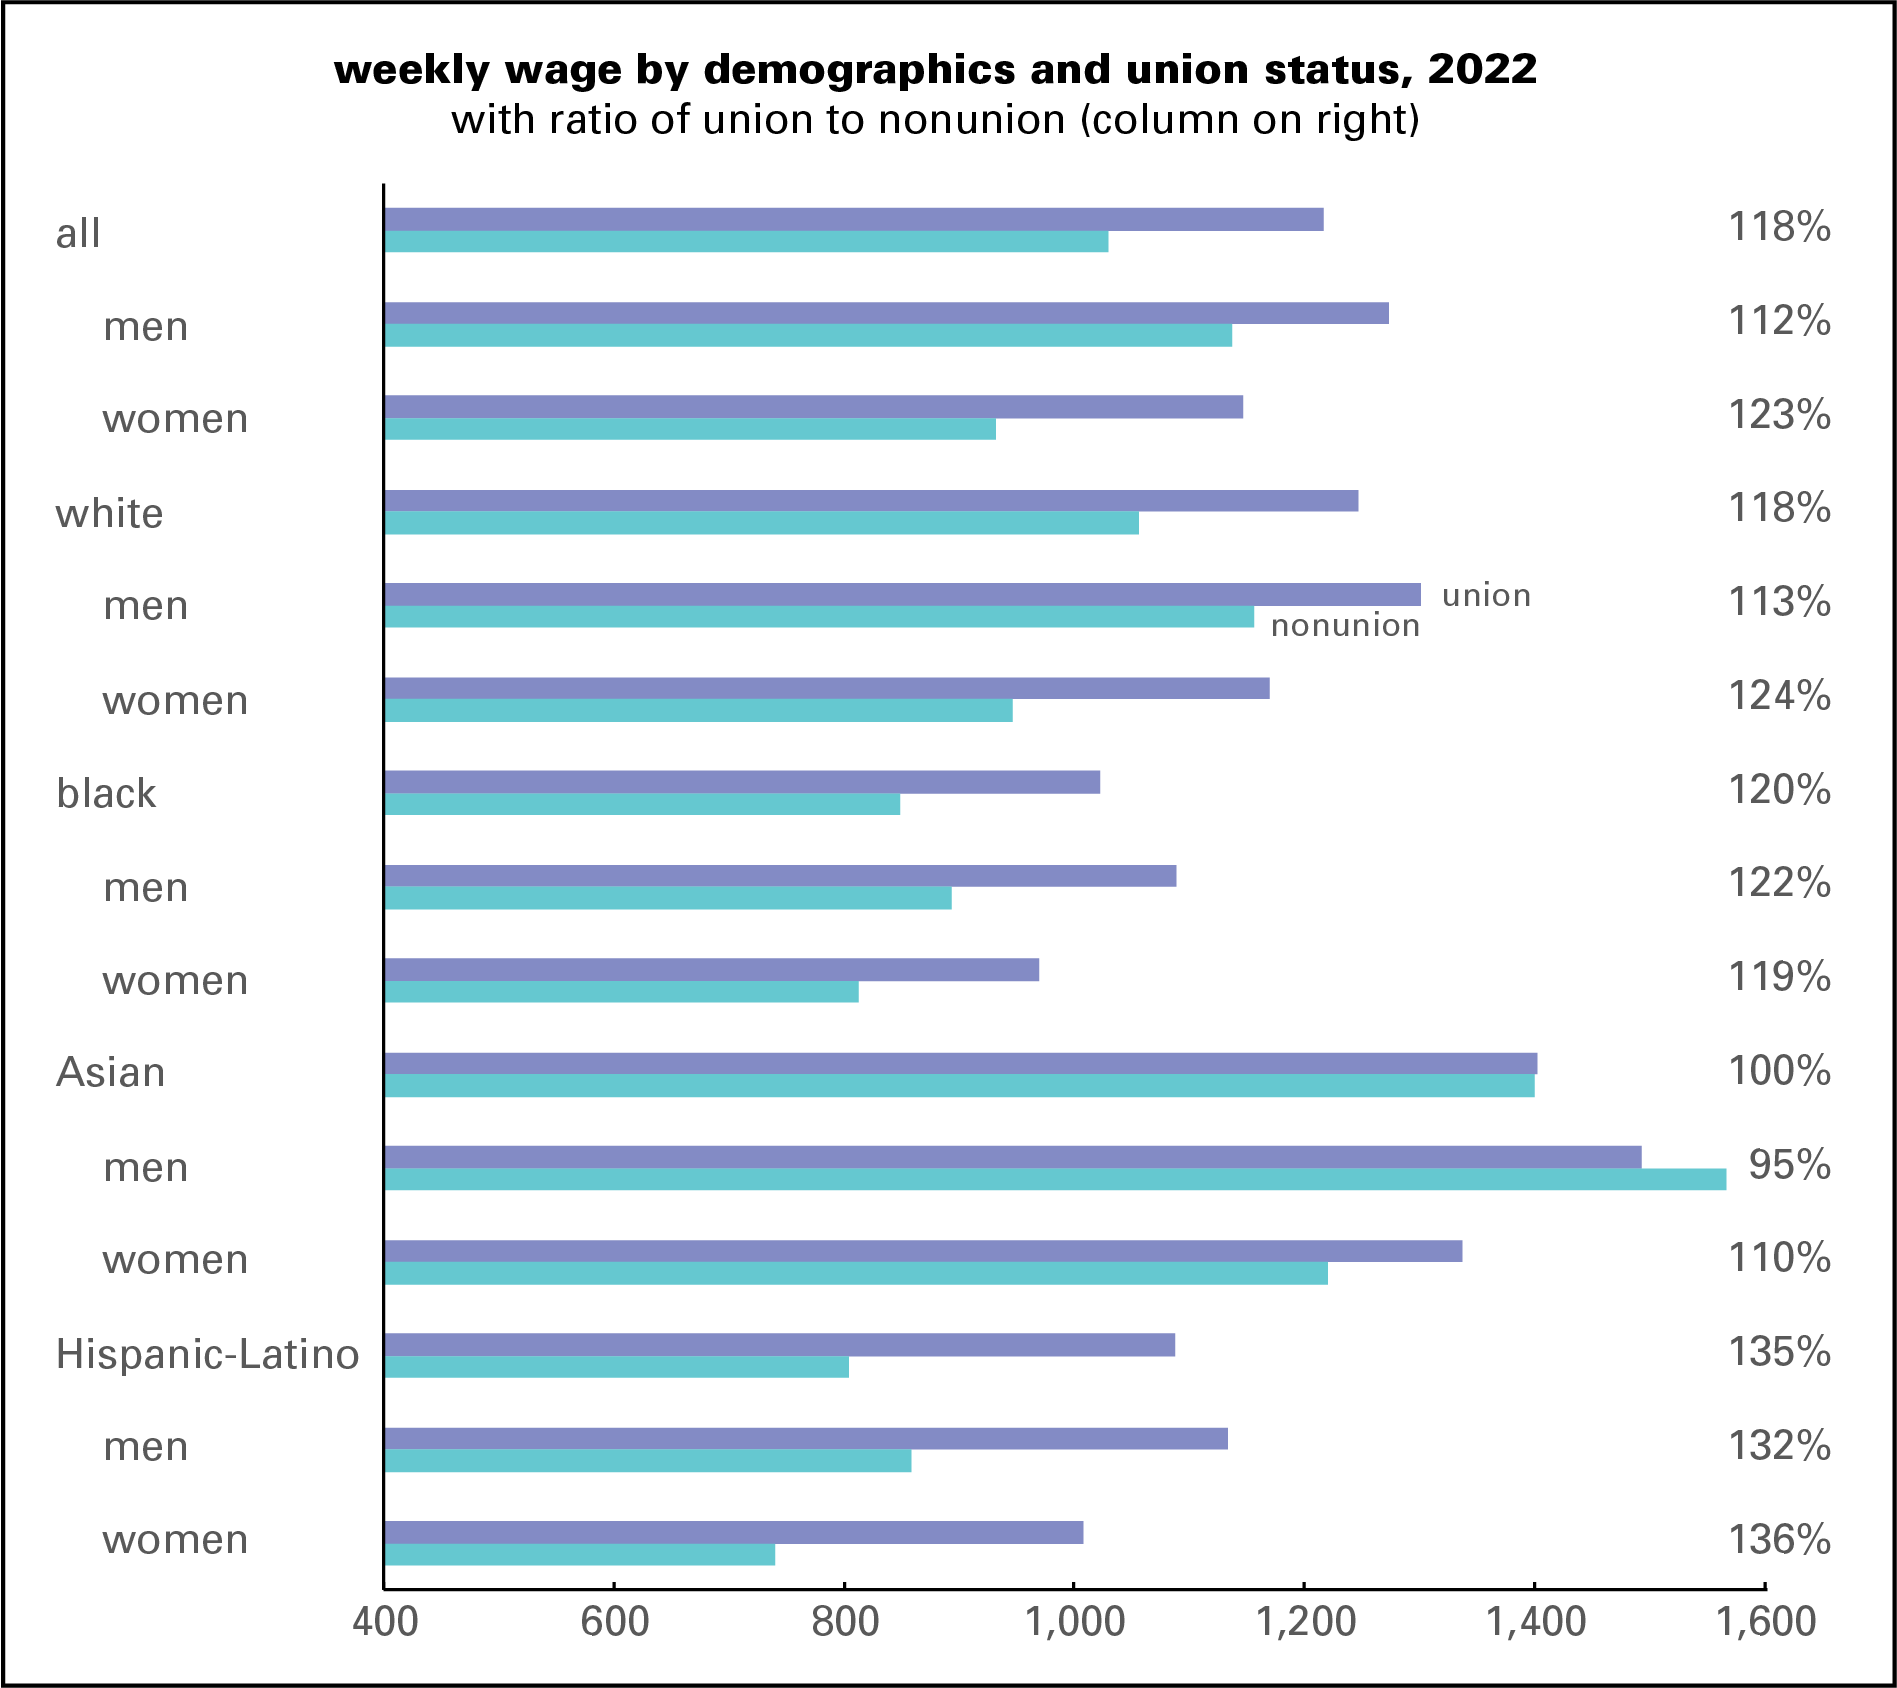
And the evidence on pay is strong: weekly earnings for the average union worker are 18% higher than the nonunion worker. As the graph below shows, union workers enjoy a premium for all major demographic groups except Asian men (almost certainly a function of their disproportionate presence in tech, a high-wage, low-union sector).
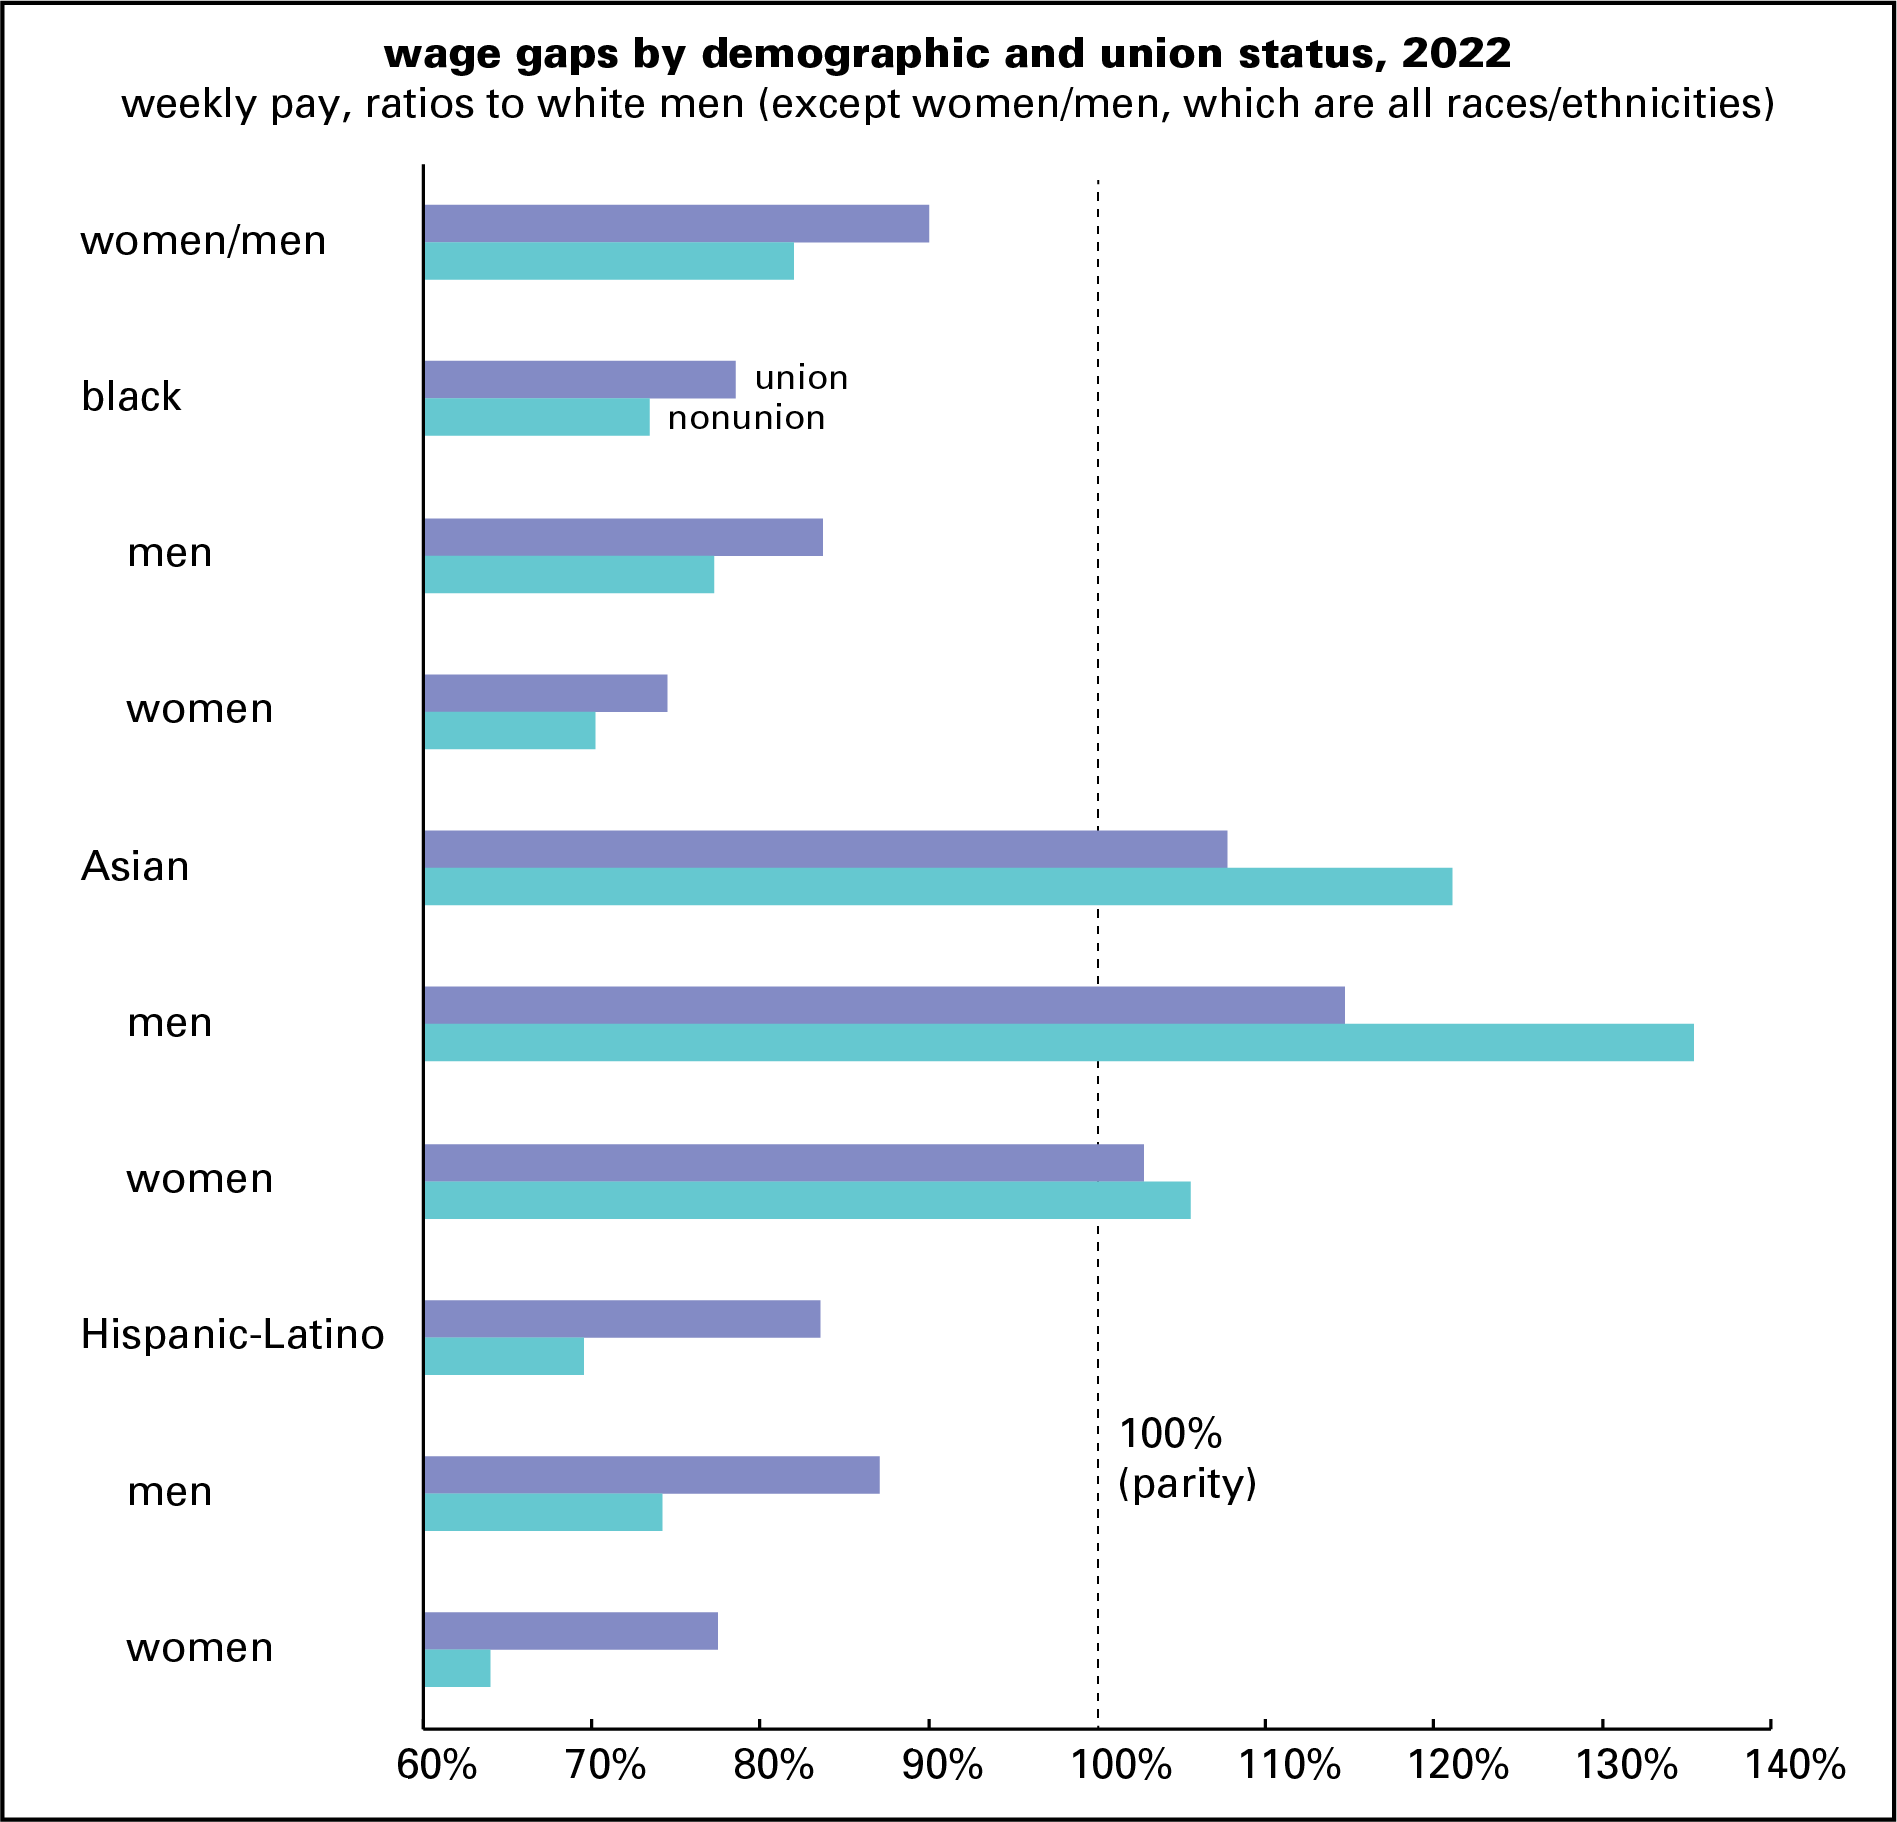
Unions also raise the wages of traditionally discriminated-against workers. For example, nonunionized women working full time have a weekly wage 82% that of nonunionized men; for the unionized, the ratio rises to 90%. (These comparisons are for full-time workers. Since more women than men work part-time, this is not a comprehensive portrait of the gender gap. Nonunionized black women have a weekly wage 70% that of white men; a union raises that to 74%. For black men, the numbers are 77% and 84%. And so on, as in the graph below. The only exceptions to the rule are Asian men and women (though unions do raise pay for Asian women).
Yes, there are many things wrong with American unions. But they still do a lot for their members, and everyone should have one.
Data notes 1) Nonmanufacturing is overwhelmingly services, but it also includes mining and construction, which are classified as goods-producing. Together they account for less than 7% of private employment. Though it was never huge, mining’s share of private employment has declined a lot over the decades, from 1.5% in 1983 to 0.5% last year. Construction’s share, however, has been steady, at just under 6% of private employment. 2) Not included in these union density numbers: workers who are not members but are nonetheless “represented by” unions, meaning they’re covered by a union contract even though they’re not paying dues. They’d add about 10–12% to the union count but adding them wouldn’t change the fundamental story. One might consider them free-riders. 3) BLS union data by industry begins in 2000. In 2002, there was a change in the official industrial classification scheme that makes earlier data not strictly comparable to later. While this matters to purists, the break is barely visible in the data and doesn’t at all change the long-term picture. 4) The BLS doesn’t publish the pre-2000 data on its website; the unpublished history was generously furnished by BLS staff.

