
Reflections on the current disorder
[This is the edited text of a talk I gave via Zoom, like everything else these days, sponsored by the North Brooklyn chapter of the Democratic Socialists of America. It reprises and updates several things I’ve written recently, but it’s hard to be original these days. Video will be posted, but who wants to look at me? The Q&A was quite good though.]
Before I get into the body of my talk, I want to celebrate our electoral victories and say how proud I am to be a member of DSA. If you’re not a member, please join. As someone who was a socialist throughout the dark days of the 80s, 90s, and 00s, let me say how great it is to see socialists in Congress and legislative bodies around the country, not to mention vast uprisings across the country. Onward to state power and social transformation!
Long ago I was a right-winger, fervently but briefly, and the title of this little talk, “Reflections on the current disorder,” was one that the dreadful old reactionary William F. Buckley used as his all-purpose evergreen when he was asked what he was going to talk about. Just a tasteless joke, sorry.
cyclical history
This is not your typical recession. Back in the old days, meaning three or four decades after the end of WW2, there was a textbook pattern to the business cycle. After a few years, an expansion would mature, the stock market would get exuberant and frothy, labor markets would tighten (meaning wages would start to rise more rapidly than the employing and owning class liked, because tight labor markets increase workers’ power), inflation would pick up, and the Federal Reserve would raise interest rates to provoke a recession. Stocks would decline, the overall pace of business would slow, unemployment would rise, and wage and price pressures would ebb. The employing and owning class would then feel better about the balance of forces, the Federal Reserve would lower interest rates, and recession would turn into recovery and expansion.
All that began to change with the onset of the neoliberal era forty years ago. The deep recession of the early 1980s crushed labor and led to a massive onslaught on unions and deep cuts in social spending. Wall Street went wild with takeovers and restructurings that led to job cuts, wage cuts, and speedup. The capitalist class, firmly in the driver’s seat, demanded higher profits and higher stock prices above all other priorities.
This has undoubtedly been a great time to be rich. But things haven’t been so great for everyone else. And the whole system got more unstable. Instead of the neat boom and bust cycle I described earlier, we had insane bubbles, reckless speculative manias that would end in crashes. The first was as the leveraging mania 1980s turned into the 1990s; the second, as the dot.com mania of the 1990s turned into the 2000s, and the third as the housing mania of the early 2000s ended in the 2008 crash. Each recovery from those crashes got weaker and weirder, with the very upper brackets making out like bandits and much of the rest of the population feeling like the previous recession had never ended.
The point of this compressed history is that the US economy was getting sicker for a long time. Neoliberalism, by which I mean the belief that markets should be insulated from any political influence and capitalists should be free to do as they please with little restriction, had seriously undermined the system’s integrity. (When I say insulation from political influence I mean of the humane sort. Intervention to make the rich richer, or bail them out when they hit a wall, was perfectly ok—encouraged in fact.) The competence of the state, military and police functions aside, were consciously eroded. Public investment was squeezed, and our physical and social infrastructure left to rot. Class and racial disparities in health widened along with income inequality and economic precarity. Debt levels kept rising, and the cult of maximizing stock prices meant corporations didn’t invest or hire. Many borrowed money just to buy their own stock to raise its price, leaving them in weak financial shape when this crisis hit.
systemic rot
This economic crisis is different from both sorts I’ve been describing. It’s not the garden-variety recession of the post-World War II decades, nor is it like the financial crises of the neoliberal era. It’s the result of mass illness disrupting normal economic life, making it impossible for people to work (though of course many were forced to at great peril) or shop or do all the things that keep the wheels of consumption and production spinning.
But this crisis hit a system that had been structurally weakened because of the systemic rot—the erosion of state capacity, declining health among a lot of the population, increasing financial fragility, inequality, precarity, and the rest. Fragility and precarity are widespread even in what are nominally “good” times.
According to an annual survey of economic well-being by the Federal Reserve—an institution that ironically shows more interest in the topic than most others in US society— done last October, when the unemployment rate was under 4%:
• 16% of adults were unable to pay their monthly bills in full, and another 12% said they couldn’t pay if they were hit with an unexpected $400 expense
• Over a third couldn’t meet an unexpected $400 expense either out of savings or using a credit card they’d pay off at the end of the month. The rest would either carry a credit card balance or throw up their hands in despair.
• One in four skipped medical or dental care because they couldn’t pay
• Almost one in five had unpaid medical debt.
These are averages. It will not surprise you to learn that white people did better than average, and black and Latino people did worse. For example, almost four in five white people were doing ok or living comfortably, compared with about two in three black and Latino people. You could turn that around, though: even in a relatively good year, one in five white people were barely getting by. Almost four in five straight people (yes, I was surprised the Fed asked this question) were doing at least ok, compared with two in three identifying as lesbian, gay, or bisexual.
dimensions of crisis
So that was the situation going into this hellscape. In June, the official unemployment rate was over 11%, three times what it was when the Fed took that survey last year. Unemployment had come down from a peak of almost 15% in April, as people were recalled to work, but that 11% is higher than any month between May 1941 and April of this year. It never got that high during the deep recessions of 1982 and 2008–2009. Under this definition of unemployment, you have to have looked for work in the previous month. If you broaden the definition to include people who’ve given up the job search as hopeless and those who are working part-time but want full-time, it was 18%. Though down from April’s peak, it’s still higher than at any point during the Great Recession of a decade ago.
And it looks like the late spring recovery has run out of steam. Well over a million people a week are still applying for unemployment insurance, and over 30 million are collecting benefits. Not quite half those beneficiaries are on the rolls because of expansion of eligibility to freelancers and other who would not have been eligible under traditional programs.
That expansion of unemployment insurance eligibility was part of the first pandemic relief package, the so-called CARES Act. The CARES Act also included a $600 weekly benefit on top of the normal state benefits. Benefits vary widely by state, ranging from $550 a week in Massachusetts to $215 in Mississippi. (Most southern states pay well under $300.) The national average pre-supplement was $342. So that $600 supplement made a huge difference to millions of people. It has now expired.
As I wrote last week in Jacobin, the unemployment insurance provisions of the CARES Act were the most generous welfare state measures in our ungenerous history. Job losses from late March onward resulted in steep declines in wage and salary income—almost twice as bad as the declines after the 2008 financial crisis and exceeded only by the onset of the Great Depression in the early 1930s. But those declines were more than offset by the huge increases in unemployment insurance benefits, along with the $1,200 checks. These payments were so large that personal income actually rose overall despite the giant hit to wage and salary income.
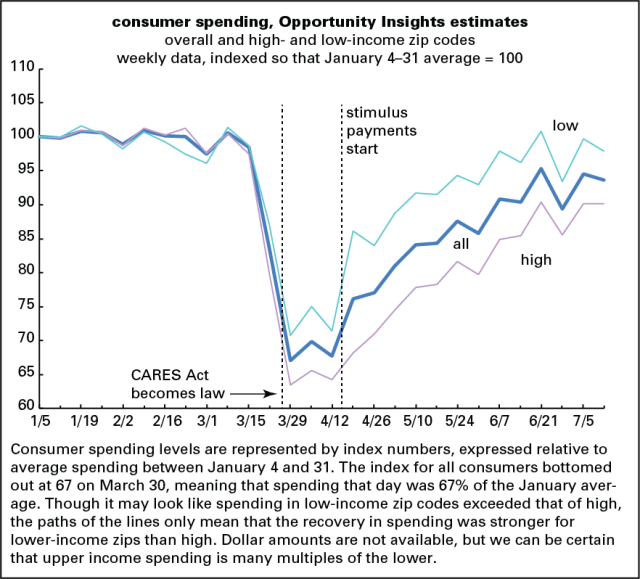
Personal consumption spending collapsed in late March and early April but stabilized almost the very day the CARES Act passed and began rising when the payments started flowing. According to near-real-time tracking of debit and credit card spending compiled by the Opportunity Insights project, led by the extremely energetic economist Raj Chetty, spending nearly recovered to pre-crisis levels by mid-June. (The graph below is updated from the one in Jacobin. Opportunity Insights is now reporting weekly, not daily, data.) Since then, they’ve begun to slip—and now that the $600 emergency payments have stopped, we can expect them to fall sharply.
These numbers are, of course, aggregates. Lots of people almost certainly haven’t been so lucky. Many reported huge difficulties in filing for unemployment insurance because our systems are so antiquated. Bloomberg—the news service, not the billionaire ex-mayor—was out with a story earlier today that estimated that as much as a quarter of benefits went unpaid because of bottlenecks.
Despite the payments, food banks have been doing record business. According to a new experimental weekly survey from the Census Bureau, there’s been a decline of over 30 million people in the number reporting that they’re getting enough of the food they want. Most, 25 million, say they’re getting enough food, just not what they want, and the rest, almost 5 million, don’t have enough to eat at least some of the time.
no relief
Still, there’s no question the supplemental benefits helped a lot. But no longer.
There will probably be a second covid relief bill, but the two parties are far apart on details and the Republicans are divided among themselves. Dems are looking for a $4 trillion package; Republicans, a quarter that. The GOP is leaning towards another round of $1,200 checks, $200 in supplemental unemployment benefits and a cap at 70% of previous wages (something many states say would take them weeks to calculate), job retention tax credits, and liability shields to protect employers against suits from employees forced back to work. They’re also trying to slip the Pentagon almost $4 billion to replace money shifted from its normal budget to build Trump’s border wall. Trump himself wants almost $2 billion to fund a new FBI building on its current site, rather than one out in the suburbs as had previously planned. The reasons for Trump’s concerns, which he expressed right on taking office, are not fully clear, but may involve assuring that nothing could be built on the current site that would compete with his hotel down the block. The Dems want aid for busted state and local governments and school districts; Republicans don’t. The bickering is likely to drag well into August, which means lots of seriously broke people for weeks on end.
And why do the Republicans want to put a tight lid on unemployment benefits? Because, as Treasury Secretary Steve Mnuchin said, “We’re going to make sure that we don’t pay people more money to stay home than go to work.”
That attitude isn’t stopping Mnuchin for looking to forgive loans extended to businesses under the Paycheck Protection Program, or PPP. Businesses who took the loans were supposed to keep employees on payroll; if they did, the loans would be forgiven. It’s not clear how many did keep employees on the payroll, or how many gamed the system by laying off and then recalling workers before the deadline, but Mnuchin wants to forgive the loans without knowing auditing what happened.
That whole program was a disaster. Much of the money went to areas least affected by either the virus or unemployment. It was administered through banks rather than public authorities, and their decisions were often opaque, arbitrary, and slow. ProPublica reportedthat temp firms got PPP money to “retain” employees that they were renting out to their clients, meaning they got paid twice for the same work. The contrast with European job preservation schemes is striking. They paid employers promptly to keep workers on the job and they did. European unemployment rates have risen only slightly, and their economies look mostly to be recovering. Ours is a wreck.
The recovery in employment is also running out of steam. That same weekly Census Bureau survey reports a 5% decline in employment between mid-June and mid-July, almost 7 million people in numerical terms. As spending slips because the expanded unemployment benefits have expired, it’s hard to see how those employment numbers could do anything but decline further. Add to that the increasing covid toll in the South and West and we have a serious problem on our hands.
How long could this recession last? A long time, I’d say. Not only is a recovery dependent on getting the virus numbers seriously down, there’s a lot of damage to the real economy. As I said at the beginning, this is not merely not a conventional old textbook recession, a story of what the mainstream calls overheating followed by an imposed cooling followed by a normal recovery nor a financial crisis recession, where recovery is inhibited by a huge debt overhang. It’s one caused by immense damage to the real sector—supply chains broken, workers kept off the job by sickness and death (and the fear of sickness and death), firms bankrupted by months of closure who may never reopen and rehire. The Fed can pump money into the markets and the federal government can deficit spend on a previously unimaginable scale, but these problems will take time to heal.
And we haven’t really recovered from the 2008 crisis either. That led to serious long-term economic damage. Had the economy continued to grow in line with its 1970–2007 trend, GDP would be about 20% higher than it is now. GDP is a deeply flawed measure; it says little about distribution or quality of life, but it is what the capitalist system runs on. Listen to any pundit or propagandist, and growth is what the whole set-up is all about. And by this most conventional of measures, American capitalism is failing badly on its own terms.
With all this gloom, why has the stock market been doing so well? I see at least four reasons.
One, the financial markets’ reputation for rationality is thoroughly unearned. The markets are populated by traders with the emotional volatility of fourteen-year-old boys. (Actually, I have a fourteen-year-old son and he’s far more stable than a stock trader.)
Second, the markets have been convinced the virus is going to go away and everything will be better very soon. That bounceback was supposed to begin in the second half of the year; we’re a month into the second half of the year and it’s not here yet. (A major reason to worry: Trump economic advisor Larry Kudlow, who is almost always wrong about everything, says we’re going to see 20% GDP growth in the third and fourth quarters of this year. The US has never seen 20% growth over two quarters since the end of World War II; the closest we came was not quite 15% during the Korean War buildup of 1950. I’m tempted to put a negative sign in front of whatever Kudlow predicts.)
Third, the Federal Reserve has been pumping trillions into the markets for months; that’s potent fuel for a speculative fire.
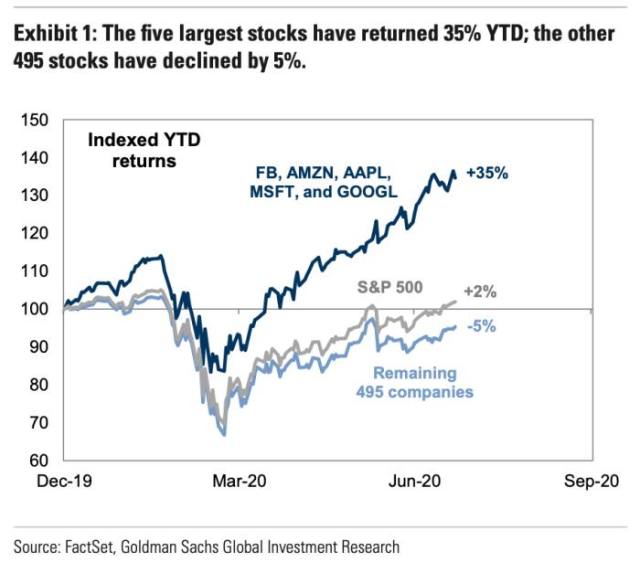
And fourth, most of the market’s gains are concentrated in five big tech stocks, Facebook, Amazon, Apple, Microsoft, and Google. They’re up 35% since the beginning of 2020; the rest of the market, as measured by the S&P 500 index, is down 5%. (See graph below, lifted from that Financial Times article.) A 5% decline is not big, given the damage to the real economy, but it tells a much different story from the tech biggies.
WITBD?
So, to ask Lenin’s classic question, what is to be done? Most urgently, people need serious income support, at least $2,000 a month for at least six months. We need eviction and foreclosure moratoriums to prevent what looks like an inevitable wave of mass homelessness as people find it impossible to pay their rent and mortgages. State and local governments and school systems need big support; if they don’t get it there will be massive job and service cuts that will generate misery and deeper depression. Schools can’t reopen safely without a major infusion of resources.
Longer term never has the Green New Deal seemed so practical, Nancy Pelosi’s “green dream or whatever” to the contrary. It has everything we need: the massive public investment program to repair our rotting infrastructure, and the kinds of social spending we need to make the poor not poor and the working and middle classes comfortable and secure.
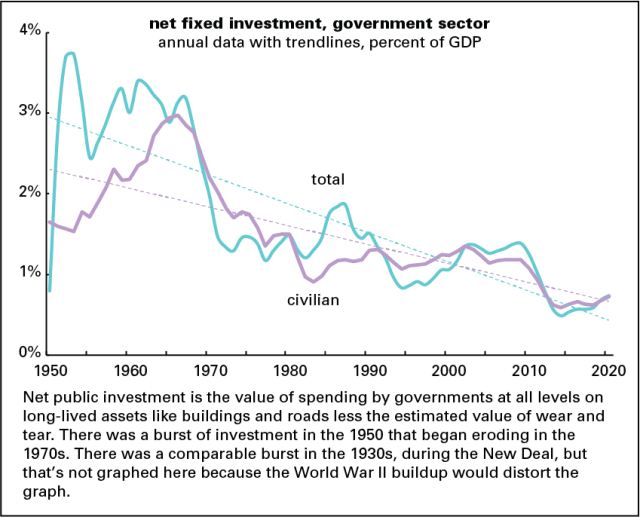
For decades, civilian public investment net of depreciation has hovered just above 0, meaning that we’re doing little better to replacing things as they decay. (See graph below.) This economic statistic can easily be confirmed just by walking around anywhere in the US outside our richest neighborhoods. We need massive investment in public infrastructure on the model of the New Deal, both to fight the slump and to make this country habitable for the bottom 80–90% of the population. That infrastructure investment must not simply be more of the same—not airports and highways but clean energy and high-speed rail. The investment program needs to be part of a conversion of an economy based on exploitation of workers and nature into something humane and sustainable. The New Deal also subsidized artists and writers, and the projects it created were often beautiful—not driven by the mean, philistine view of life that we usually associate with the public sector.
As an example of the new kind of investment we need, we could put now-unemployed auto workers back to work building vehicles that don’t threaten life on earth. A model to think about was the (sadly unsuccessful) proposal to transform a plant in Ontario GM closed into something earth- and worker-friendly.
We also need to think about industries we don’t want to see recover. The airline industry is in dire shape. It’s also ecologically destructive and we need to imagine a world in which we all continue to fly much less. The cruise industry is filthy and wrecks the towns where those giant ships dock, and it should be euthanized. This would be a propitious time to nationalize the oil and gas sector, undertaken with the idea of putting them out of business. We must move as quickly as possible to stop the use of fossil fuels, and as long as these entities exist, the political and economic obstacles to that necessity are nearly impossible to overcome. Big Oil could be Because the price of oil has fallen so dramatically, the value of the major carbon producers has cratered. The five biggest US-based oil companies (Exxon Mobil, Chevron, ConocoPhillips, Phillips 66, and Valero) have a combined market capitalization of about $400 billion, which is equal to about an eighth of JPMorgan Chase’s total assets and less than 2% of GDP. Shareholders will whine, but as the financial world wakes up to the inevitability of carbon’s obsolescence, the value of their investments will tend towards 0 anyway. In all cases, workers should be protected, not displaced, but the underlying businesses should be wound down or severely shrunk.
The banking system is in decent shape now, surprisingly perhaps, but should the recession continue, as I think it will, this will change as more people and businesses find themselves unable to service their debts. Nationalize several of the largest banks—and unlike the nationalizations in Sweden in the 1990s and the UK a decade ago, they should not be undertaken with the idea of returning them to private ownership as quickly as possible, after the government eats the losses. They should be run on entirely different principles—something like a financial utility, that provides basic services like checking and savings accounts, but not incomprehensible financial products.
There’s no reason the nationalized banks couldn’t be run to finance the Green New Deal. Some of the GND will have to be financed with traditional tax- and bond-financed public spending, but there’s no reason these socialized banks couldn’t participate.
Along with the nationalized banks, we should create something on the model of the Reconstruction Finance Corporation, to finance the GND. It would be a publicly capitalized bank that would evaluate and fund projects like clean energy generation and new models of food production.
At the same time, we should severely rein in with an eye to abolishing, the shadow banking sector of private equity (PE) and hedge funds. PE has saddled companies with crippling levels of debt, which enrich their investors but put them at great risk of failure even in relatively good times. (A subset of PE, venture capital, can play a more constructive economic role, but it’s quite small: there was less than $10 billion in early-stage financing from the sector last year.) Hedge funds do little but destabilize markets and serve no useful purpose.
And never has the need for Medicare for All been so clear. And the reason for that isn’t only the need of freeing people from the anxiety of not being able to pay for essential care, but also because there is little in the way of planning for the distribution of health care resources beyond what The Market demands. A major part of the reason the US is so unprepared to handle the coronavirus crisis is that hospitals are built and outfitted according to where the money is, not where the needs are. Hospitals in both cities and rural areas are broke and closing in the middle of a health emergency. They need to be built where they can serve people who need them.
A lot of this may seem pie in the sky, but who ever thought there’d be a socialist caucus in the New York State legislature? The right still has political power but it’s widely discredited, and mainstream Democrats are out of ideas. We’re deep in a massive economic and social crisis and we’ve got the energy and ideas and they don’t. Now is not the time to be shy!
Fresh audio product
Just added to my radio archive (click on date for link):
July 23, 2020 Jason Wilson on the protests and storm troopers in Portland • Forrest Hylton on COVID-19, repression, corruption, and drug gangs in Latin America
SNAP election
[This serves as an addendum to my article on expanded unemployment benefits Jacobin just posted.]
In April, the most recent month available, almost 6 million people were added to the food stamp rolls, reversing the long decline after the 2008–2009 recession. In percentage terms, that’s the biggest monthly increase since 1970, when the program was young and participation was just taking off. This surge is a thing unto itself.
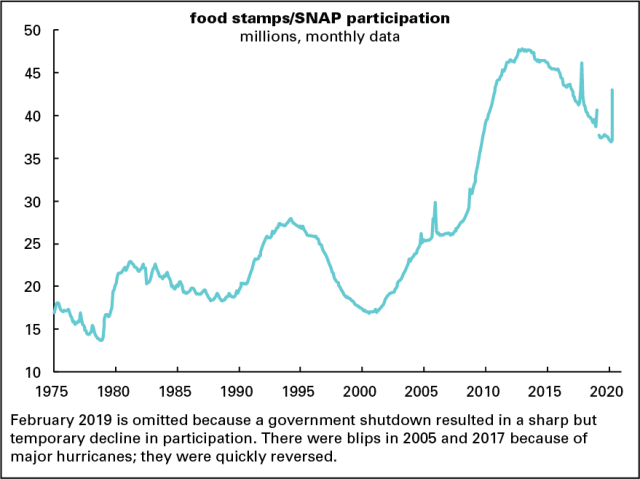
The number of participants in the food stamp program—which was renamed the Supplemental Nutrition Assistance Program (SNAP) in 2008, though the old name has stuck—declined steadily in the late 1990s, as unemployment fell sharply and real wages rose. But with the 2001 recession and the weak recovery/expansion that followed, participation rose steadily, more than doubling between the 2000 low and the 2013 high. It fell steadily through early 2020, but as a percentage of the population never got below roughly twice the trough twenty years earlier.
Benefits are far from generous, though they are a lifeline to many millions of people. As the graph shows, the real value of the average monthly benefit was increased during the 2008–2009 recession, but that was allowed to erode. In real terms (using the price index for food for preparation at home), it’s just 7% above where it was in 1992, even though the cost of food prepared at home is up 78% since then.

The average monthly benefit per person was $181.60 in April, which works out to a rather tight $1.98 per meal. (All the SNAP stats are here.) That benefit level is about two-thirds of what the Agriculture Department calls a “thrifty” food budget for a non-elderly adult—a diet that, by the Department’s own accounting, doesn’t provide the recommended daily allowances of vitamin E or potassium; sadly, as they declare in cool bureaucratic prose, “a solution could not be obtained.”
Despite the tightness of the budget, and the obvious need for food assistance even in more normal times, the Trump administration and Congressional Republicans have been trying to cut the program dramatically. It’s not a major budget item—0.3% of GDP—but reactionaries hate subsidizing food for the poor. Trump’s 2021 budget proposed cutting SNAP by nearly a third over the next decade. More recently, the administration tried to impose new regulations that would have kicked about 700,000 people off food stamps, a move that was blocked by a judge in March. Agriculture Secretary Sonny Perdue—no relation to the chicken brand—justified these bits of savagery by saying the program was meant to provide “assistance through difficult times, not a way of life.” Because nothing says luxurious ease like a budget of $1.98 per meal.
Fresh audio product
Just added to my radio archive (click on date for link):
July 16, 2020 Claire Potter, author of Political Junkies, on how our politics got so divided • Sonia Shah, author of this article, thinks about the pandemic in more than biomedical terms
Fresh audio product
Just added to my radio archive (click on date for link):
July 9, 2020 Erin Thompson on art crime and the history of toppling statues • Jennifer Cohen on gendering the health and economic crises [back after another brief vacation break]
Fresh audio product
Just added to my radio archive (click on date for link):
June 25, 2020 Nikhil Pal Singh on race, class, policing, protest • Michael Kinnucan of Brooklyn DSA’s electoral committee on left victories in the NYC primary elections
Fresh audio product
Just added to my radio archive (click on date for link):
June 18, 2020 Eric Reinhart on jails as COVID-19 spreaders (article here, AER article on pretrial detention here) • Erin Hatton on “coerced” workers, from prisoners to grad students [back after vacation break]
Fresh audio product
Just added to my radio archive (click on date for link):
June 4, 2020 Alex Vitale, author of The End of Policing, on why cops are being so brutal and what should be done with them • Ben Tarnoff, co-founder of Logic magazine, on tech worker organizing (essay here)
NYC has way too many cops
As do many other cities, but since I’m a New Yorker, I’m leading with the hometown news.
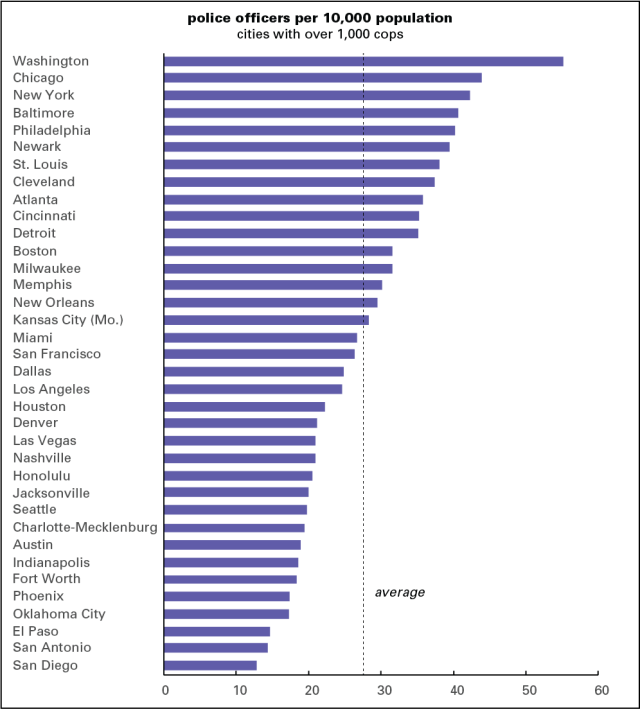
US cities vary widely in the number of cops they have relative to their population, as the graph below (drawn from data assembled by Governing magazine). Among big cities, DC, Chicago, New York, Baltimore, and Philadelphia top the list, with over 40 officers per 10,000 people. These are well above the national average of just under 28 per 10,000. Cities toward the bottom of the list have 20 or fewer.
If New York had an average number of cops, and not one of the highest ratios to population of any city in the country, we’d have 23,645 officers, not 36,228. If we had San Diego’s ratio, we’d have just 11,422, half as many as that average (which falls between Miami and Kansas City).
So, if New York wanted to be just average, we could fire 12,500 cops. If we wanted to be like San Diego, minus the nice weather and the US Navy, we could fire almost 25,000. We don’t have to be harsh about it. We could give them nice new jobs doing useful things instead of beating and shooting people, or a generous severance package if they prefer.
Even 11,422 is probably too many cops. But that’s another conversation.
Fresh audio product
Just added to my radio archive (click on date for link):
May 28, 2020 Excerpts from a virtual panel sponsored by Red May, Seattle: Jodi Dean, Leo Panitch, and Asad Haider on the current crisis, with lots about how socialists should engage with the state (full session, with video, here)
Fresh audio product
Just added to my radio archive (click on date for link):
May 21, 2020 Vincent Bevins, author of The Jakarta Method, on the US-sponsored strategy of mass murder during the Cold War • Kyle Beckham, lecturer in education at the University of San Francisco, on schooling during the pandemic
Fresh audio product
Just added to my radio archive (click on date for link):
May 14, 2020 Thea Riofrancos, co-author of this book, on why the Green New Deal is more urgent than ever • Alexander Zaitchik, author of this article, on how the profit-driven drug industry is an obstacle to developing a vaccine
Measuring the carnage
When Trump promised to end “American carnage” in his inaugural address, he had no idea he’d end up presiding over mass death and economic collapse, but history can be a brutal ironist. Here’s a look at the bloodletting in the job market, which is central to most people’s economic well-being.
Most of the time, the monthly employment report from the Bureau of Labor Statistics is of interest mostly to econogeeks, but the April 2020 edition, released on Friday, May 8, was like no other since the end of World War II. The scale of job loss and the rise in unemployment had nothing even remotely like a precedent.
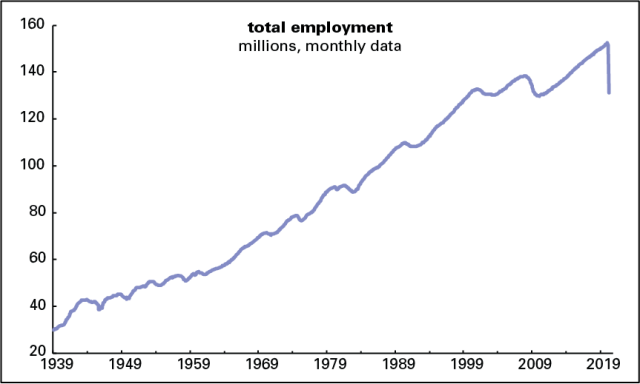
Employers axed 20.5 million jobs in April, making for a decline of 12.9% from a year earlier. That annual loss is a record by a wide margin. The previous record was -7.6% in September 1945, during the postwar demobilization. Total employment is back to where it was in February 2011, which was itself back to March 2004 levels, thanks to job losses in the Great Recession (a name that might have to be retired) and its aftermath. And that March 2004 level was the same as February 2000’s, because of the 2001 recession and the jobless recovery that followed it. So, employment now is the same as it was 20 years ago even though the adult population is up 48.3 million, or 23%. (See graph below.) We’re almost certain to see giant losses for May when the numbers are released on June 5.
Almost every sector and subsector lost jobs, and lots of them. Manufacturing lost 1.3 million; retail, 2.1 million; professional and business services, 2.1 million; education and health, 2.5 million (including 1.4 million in health care, a bizarre development during a massive health crisis); and leisure and hospitality, dominated by bars and restaurants, 7.7 million. Government was off almost a million, all of it at the state (-180,000) and local (-801,000) levels. It’s distressing that at a time when people need public services, they’re being radically shrunk, and a sector that is supposed to counter recessions by maintaining stable employment is acting instead as a downward accelerant. During the worst phases of the Great Recession, state and local government employment declined at an annual rate of around 1.5%; April’s level was off 4.5% from a year earlier. Austerity at the state and local level undermined the early Obama stimulus package, and continued as a drag on growth throughout the expansion.
Weirdly, average hourly earnings rose an eye-popping 4.6%—for the month, not the year, over 15 times the 2018–2019 average. The reason is that job losses are concentrated among lower-paid workers, which pushed up the average. It’s likely job losses will climb up the income ladder in coming months.
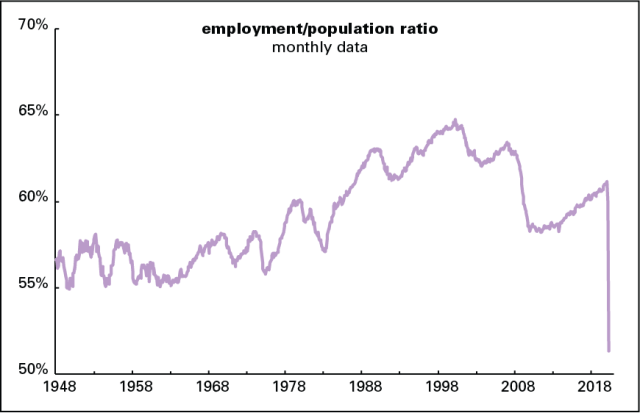
These figures come from a survey of employers, known as the establishment survey. The BLS also conducts a survey of people, known as the household survey. It was, if anything, even grimmer than its establishment counterpart. It found job losses a million higher (the two surveys often differ in the short term, though they always wind up telling the same basic story). The employment/population ratio, the share of the adult population working for pay, cratered, falling from 60.0% in March to 51.3% in April, an all-time low. (See graph below.) In the 1950s, before the mass entry of women into the labor force, it occasionally got as low as 55%. Its all-time high was 64.7% in April 2000. It never got anywhere near that high again, either in the early 2000s or in the 2009–2019 expansion, because of a mix of an aging population and weak economic growth. If people were employed at that rate now, there’d be almost 35 million more working.
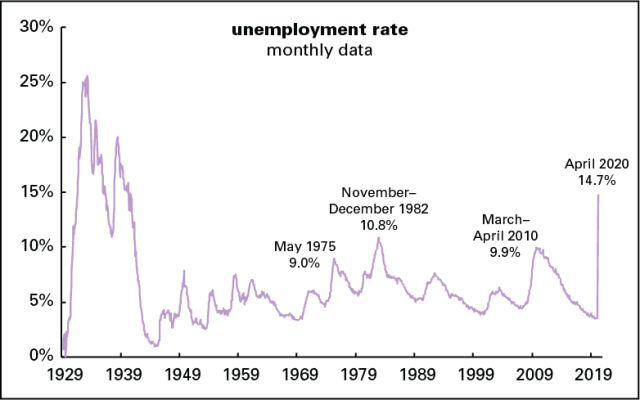
Unemployment soared, the rate rising more than 10 points from 4.4% to 14.7%. As the graph below shows, that’s well above previous peaks since the end of World War II. It took almost two years after the 1929 stock market crash for unemployment to hit 15%; we’ve done it in two months.
The BLS reports a fairly obscure set of stats called employment flows, which measure moves in and out of employment and unemployment. They report that almost one in six people who were employed in March lost their jobs in April.
As sharp as the April increase was, it was partly masked by massive labor force withdrawal. You have to be actively looking for work to be counted as unemployed, and no doubt some people either saw no point in searching, or no way to do it with so much shut down, so they weren’t counted as unemployed. Also, as the BLS reported, many people who were actually laid off reported themselves as “absent from work.” Had they reported themselves as laid off, the unemployment rate would have been close to 20%.
The BLS also reports a broader measure of unemployment, called U-6, which includes people who are working part-time who want full-time work and those who’ve given up the job search as hopeless. That rose from 8.7% to 22.8%, shattering its previous record of 17.2%, set in April 2010. The histories of the headline unemployment rate, aka U-3 (the one discussed in the previous paragraph) and the broad U-6 rate are graphed below. Also shown is a predecessor of the U-6 rate, known as U-7, which was reported from 1970 through 1993. The pure verticality and magnitude of the April spikes read like a poke in the eye.

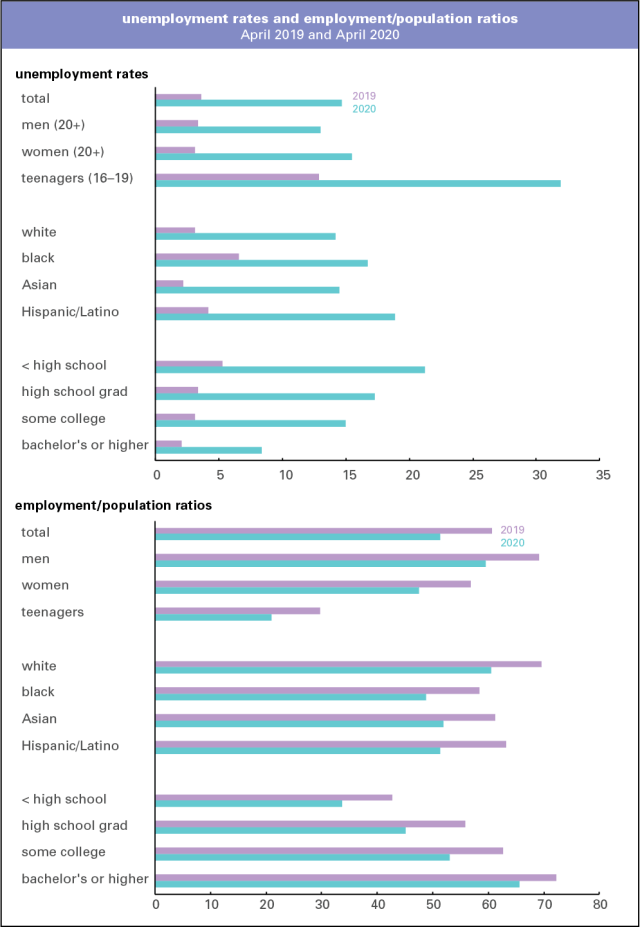
Of course, employment and unemployment vary widely by demographic, as the graphs below show. While every category saw a sharp rise in unemployment and fall in employment, the white and educated started from better positions and remain there. But things stink for them too.
If you’re desperate to find a cheering note buried amidst all the red ink, almost all the unemployed report themselves as being on temporary layoff rather than as permanent job losers. Similarly, a Washington Post–Ipsos poll reports that 58% of laid-off workers think it’s “very likely” they’ll get their old jobs back, and another 19% say it’s “somewhat likely.” One hopes this is based on sound reasoning and not wishful thinking.
Judging from the behavior of the stock market, which has recovered much of the ground it lost in the sharp selloff in February and March—and which is actually slightly above where it was a year ago—Wall Street thinks this damage is a brief bit of unpleasantness that will soon pass and come fall, it’s back to the races. I don’t get this. Thousands, maybe millions, of small and mid-sized businesses won’t be able to survive months with no revenue, and so won’t be around to reopen. Second and/or third waves of viral attacks, which are quite possible, would make a quick rebound even less likely. We’re in lots of trouble, and no one in charge knows how to get us out of it.
Data note The monthly unemployment figures for 1929–1938 were assembled by the National Industrial Conference Board, predecessor of today’s Conference Board, a think tank and data shop. They’re available from the NBER. The modern employment statistics system originated in the late New Deal, as a project of the Works Progress Administration.
Fresh audio product
Just added to my radio archive (click on date for link):
April 30, 2020 Lauren Sandler, author of This Is All I Got, on homelessness in NYC • Cathy Cowan Becker, author of this review of the Jeff Gibbs–Michael Moore documentary Planet of the Humans, on why it’s so bad

