Responding to Rasmus’s response
Jack Rasmus is out with a response to my critique of his analysis of the April U.S. employment numbers. Enlightening Rasmus looks to be a hopeless case, but since there are may be some onlookers who wonder what’s up, here are a few comments. As with yesterday’s post, his comments are quoted and italicized (though the formatting doesn’t show up on an iPhone unless you choose the desktop version—sorry!).
What is significant is that Henwood thinks the CES (Current Employment Survey) is more important and accurate than the CPS (Current Population Survey).
I never said one was more important than the other; they tell you different things. What I did say was that on a monthly basis, the CES (payroll or employer survey) requires smaller moves than the CPS (the household survey) to be statistically significant, since it’s from a much larger sample. And it’s not me who came up with that—it’s the compilers (see question 1 in the FAQs):
“The household survey and establishment survey both produce sample-based estimates
of employment, and both have strengths and limitations. The establishment survey
employment series has a smaller margin of error on the measurement of month-to-
month change than the household survey because of its much larger sample size. An
over-the-month employment change of about 100,000 is statistically significant in
the establishment survey, while the threshold for a statistically significant change
in the household survey is about 500,000.”
But the CES is not really a survey…
It is a survey. See above.
But the CPS is not just a “household survey”; it is also a survey of employment conditions of millions of smaller businesses through the survey of worker households. In fact, it can be argued that, in surveying 110,000 individuals each month, and then rotating and adding more households throughout the year, (roughly doubling the number contacted) the CPS in fact reflects a much larger body of business hiring, layoffs, and thus total employment, than does the CES.
The CES is a survey of jobs; the CPS, of people. They tell you different things. The CES is best for measuring employment, hours, and earnings overall and by industry. The CPS is great for measuring employment and unemployment by age, race, sex, educational attainment, and other demographic characteristics.
Henwood further argues that the CES 142,000 is more accurate because it is checked against the unemployment insurance system. But unemployment insurance has nothing to do with the numbers of employed or unemployed.
The UI system has a lot to do with the numbers of employed. It has less to do with the unemployed; less than a third the officially unemployed are drawing benefits. But the UI system covers almost everyone in formal employment. The quarterly comparisons are part of the Quarterly Census of Employment and Wages (QCEW). Here’s what it’s about:
“The program originated in the 1930s, and was known as the ES-202 program until 2003 when the current QCEW name was adopted. The primary economic product is the tabulation of employment and wages of establishments which report to the Unemployment Insurance (UI) programs of the United States. Employment covered by these UI programs represents about 97% of all wage and salary civilian employment in the country.”
Henwood is confused about the CES and CPS in another important way. There are more than 9 million businesses in the US economy. The 60,000/110,000 CPS survey is a statistically significant survey of employment in those 9 million. The comparison therefore should be 142,000 businesses vs. 9 million businesses. Henwood thus erroneously compares a population (CES 142,000) to a sample (60,000), when the comparison should be a business population (CES 142,000) to a business population (CPS 9 million businesses).
Rasmus’s point here eludes me. Perhaps a few numbers would help him sort things out. There are about 10 million employing establishments in the U.S. A sample of 142,000 of them is 1.4% of the total. There are 128 million households in the U.S.; a sample of 60,000 of them is 0.05% of the total. The CES’s sample is 28 times the share of its total universe as the CPS’s.
But Henwood would have readers believe the CES, with 142,000 businesses, and the 263,000 jobs created last month in that group, is all that matters.
Again, I never said one was more important than the other. In fact, three of the four graphs I included in yesterday’s post were drawn from the CPS.
Like the business press and government politicians, to believe Henwood we should take the 263,000 as the final word of the state of the US job market and forget all the rest.
I never said that either. April’s number is going to be revised next month and again the month after, and yet again next January with the annual benchmarking exercise, in which the monthly survey results are revised in accordance with the near-complete coverage of the employment universe. Revisions are generally small, but the monthly release is not the “final word.”
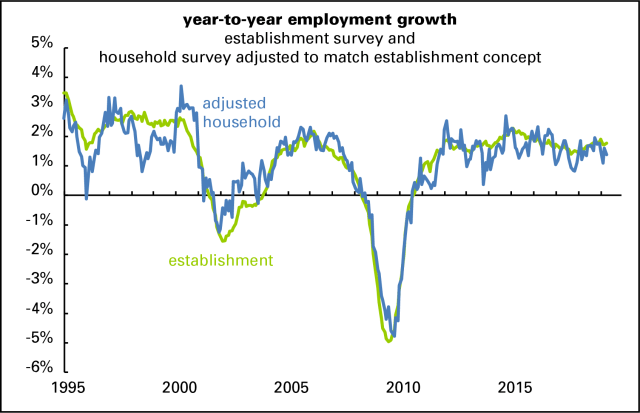
The BLS publishes a household employment series that’s adjusted to match the payroll concept (mainly by subtracting agricultural and family workers and the self-employed). It’s much more volatile than the establishment count from month to month, but over the long term they tell the same story. Here’s a graph of the two; they’ve only been publishing the adjusted household series since 1994, which is why the graph begins in 1995. Note that while the two lines generally move in tandem, the adjusted household one is far bouncier—even on an annual basis, which smooths out some of the monthly volatility.
Instead we get jobs created by large businesses (CES) and unemployment from the 9 million population of all businesses. This problem leads to often conflicting data reported by the two sources, CES and CPS.
Everything in these two sentences is wrong. It’s not a matter of opinion or interpretation—they’re just wrong.
Henwood further assumes the role of slavish apologist of government stats by defending the U-3 unemployment rate as the best and final word on the state of the US labor market. He does refer to the U-6 unemployment rate, but unquestionably accepts the government’s current (and chronic) low estimates for the U-6.
Where did I say the U-3 rate is “best and final word”? And how does Rasmus know the U-6 figures are “chronically” low? Does he have a problem with the definition or the method of collecting the raw numbers? Given how little he seems to know about the construction of the employment stats, I’m curious how he knows how they’re wrong.
The U-6 picks up ‘involuntary part time’ employment. (U-4 and U-5 reflect what’s called ‘marginally attached’ and ‘discouraged’. These latter numbers too are grossly underestimated in the official stats).
Again, how does he know? The CPS survey asks people who aren’t working if they’d like to work. Depending on their answers, they’re counted as “discouraged” or “marginally attached.” Here are the official definitions of those two categories (see note to table A-15): “Persons marginally attached to the labor force are those who currently are neither working nor looking for work but indicate that they want and are available for a job and have looked for work sometime in the past 12 months. Discouraged workers, a subset of the marginally attached, have given a job-market related reason for not currently looking for work.” That job-market reason is typically “there’s no work out there.” It doesn’t seem too strict to me to exclude people who haven’t looked for a job for over a year from these categories; others might disagree.
Henwood disputes my claim that the U-3 is essentially an estimate of ‘full time’ jobs and says “No, it refers to work of any kind, not just full-time”. But if that were true, why add on ‘part time’ as the U-6 category separately? If there were part time unemployed in the U-3 and part time in the U-6 there would be likely ‘double counting’ of part time unemployed.
Again, everything here is wrong. People who are working part-time who want full-time work are counted as employed because they are employed—just not as much as they’d like to be. Adding unwilling part-timers to the U-6 measure is a way of accounting for their partial unemployment.
How do you square the 108,000 full time jobs created in the CES with the 191,000 full time jobs lost in the CPS, Doug? What’s your explanation?
I explained that yesterday, and here I am explaining it again.
Given the CPS number showing full time job decline (191,000), and the otherwise CPS rise in part time jobs last month (155,000), in my prior article I suspected that there are more workers taking on second and third jobs. Henwood pooh poohs this and trusts the government numbers on ‘multiple job holders’ showing little change. Once again, trust the government numbers!
Where do you think the inaccuracy arises? The survey of 60,000 is poorly designed? Government economists can’t add? They’re just making shit up because they’re the gummint? The affinity of this line of thinking to right-wing know-nothingism is impressive.
Henwood provides charts that show that Temp jobs (almost always part time) have not been changing for at least the past two decades. As he says, temp jobs have been steady as a percent of the total work force for the past two decades, peaking at 2% of total jobs. “It’s barely changed for five years.” Sure, Doug. No one’s been hiring attempts except through agencies.
Again, not what I said. What I said: “This graph only shows employment arranged through temp firms. For other forms of contingent labor, like contract and on-call work, see here, here, and here. Spoiler: it’s nowhere near as big a deal as the likes of Rasmus would have you believe.”
The Labor Dept. has been covering up the growth of temp jobs since the 1990s. It produced three one-off reports, then George Bush stopped it. Too volatile.
Is Rasmus referring to the contingent worker survey? The latest version was released in June 2018 after a long delay. I wrote it up here. Despite claiming it hasn’t been produced in decades, Rasmus then cites it, but not very accurately.
How the government purposely underestimates labor stats that are embarrassing to it was clearly revealed, yet again, last year in its report on ‘precarious jobs’ (meaning temp, part time, gig, otherwise contingent, etc.). I and others have dissected that official report which claimed the gig economy was insignificant. But it turned out what the report defined as ‘gig’ was only full time uber/lyft drivers. Drivers as second and third jobbers were left out.
Completely untrue. Quoting the report on “electronically mediated employment”: “Electronically mediated workers were more likely than workers overall to work part time…. By industry, workers whose main job was in transportation and utilities were the most likely to have done electronically mediated work, with 5 percent of workers in this industry having done such work. Those employed in professional and business services, information, and other services on their main job were also more likely to do electronically mediated work, at 3 percent, 2 percent, and 2 percent, respectively.”
And from the FAQ: “This work can be done either in person or entirely online. The work could be done as a main job, a second job, or additional work for pay. For example, some people use their own cars to transport others from place to place, having obtained customers through a mobile app (such as Uber or Lyft) that also facilitates payment. Others do household chores or yardwork after finding clients through a website (such as TaskRabbit or Handy). Those who do this work entirely online could take surveys or add descriptive keywords to photos or documents through a platform (such as Amazon Mechanical Turk or Clickworker).”
As far as my suggestion that the April jobs numbers may reflect hiring of census workers, it is true the government to date has not indicated how many hired.
It has indicated how many it has hired, on a page I linked to in yesterday’s post. In case Rasmus missed it, here it is again: 1,000 in May 2018, who were laid off in July, and another 1,000 in February 2019, who are still on the job.
Henwood does give a backhanded concession to me that maybe my point of the 646,000 ‘Not in the Labor Force’ reported number indicates something is going on with the government data underestimating the total actually unemployed by having left the labor force in recent years.
Here’s what I said, after analyzing the persistently low participation rate: “That translates into a shortfall of about 2.5 million jobs, which is equal to the past year’s job growth. So there are more people on the sidelines than a 3.6% unemployment rate suggests, which is almost certainly a lingering effect of the Great Recession, whose damage persists more than a decade after its onset.”
Henwood accepts as accurate the Labor Dept’s estimate of discouraged workers (U-5) as accurate. In November 2007 just prior to the great recession the discouraged workers category represented only .2 of 1% of the labor force. Given the 10 million increase in the labor force since then, it is today still .2 of 1%. Can it be true that the percentage of discouraged workers has not risen at all in the intervening years–given the impact of the great recession, lagging economic recovery for years, and the fact of 7 million have dropped out of the labor force? It makes no sense that there should not be a corresponding increase in the percent of discouraged workers given the changed conditions of the last decade. The government data must be underestimating the discouraged worker category of unemployed (defined as out of work but having given up looking for the past year).
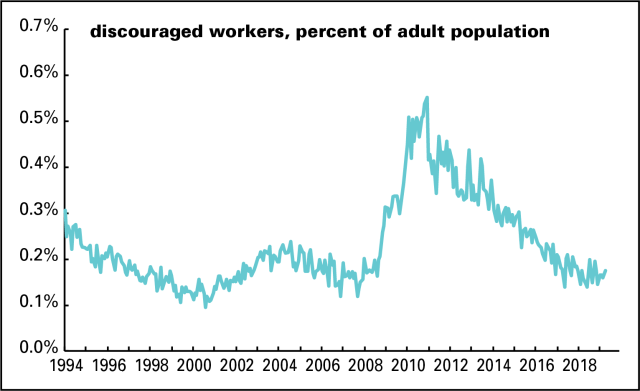
What a mess this is. The share of the population categorized as “discouraged” was around 0.16% just before the Great Recession. It peaked at 0.55% in 2010 and was 0.18% in April 2019. (See below.) Recent levels are low compared to that miserable slump, but are still slightly higher than they were in 2007, before the recession began, or 2000–2001, the strongest job market in recent decades.
The BLS estimates these things by asking lots of people lots of questions. Rasmus, by contrast, just has some feelings.
Also, they have to have looked for work at some time in the past year, not “having given up looking for the past year.”
You help them maintain the fiction that the economy is doing great, that jobs are plentiful and well-paid, and we’re all better off than we think.
What I actually said: “An awful lot of Americans have a hard time getting by. Many are working dull, even dangerous, jobs, for stagnant pay and disappearing benefits. There’s strong support for that story. But unless you want to discredit yourself, there’s no point in making a lot of less-than-half-baked claims.” Put this one back in the oven, Jack.


Let’s see Doug if you’re willing to post my reply and let your readers see the other side of the debate, as follows.
Why Government Jobs Stats Are Inaccurate:
Reply to Doug Henwood’s Apology & Defense of Government Reports
By
Jack Rasmus
In his reply to my just published article, ‘What’s Wrong with Government Job Statistics’, Doug Henwood, a ‘left’ New York intellectual who has for years accepted without question government reported stats as ‘gospel truth’, has taken the opportunity to challenge my analysis.
The nub of our differences is that Henwood accepts government Labor Dept. definitions, assumptions, and methodologies as near sacrosanct, whereas I do not. And when I challenge them, he engages in nasty personal attacks to carry his critique. I’ll not engage in that kind of exchange, but will address his various points here as follows.
For Henwood doesn’t like my most recent view that government job stats reported may not reflect a labor market as sanguine and booming, as official government and business commentary suggest. And he apparently doesn’t appreciate anyone challenging his friends over at the Labor Dept.
So let’s take a look at our latest disagreement.
In his blog today, May 6, he starts out with his first lightweight critique that in my article I refer to the two labor department jobs surveys, the CES and CPS, as two reports instead of two surveys; there being only one report, the Labor Dept.’s monthly ‘Employment Situation Report’.
Yes, there’s one umbrella ‘Situation’ report but the CES and CPS are really separate reports that are then combined but kept separate in the single ‘Situation’ report. They are indicated as ‘Tables A’ and ‘Tables B’ in the ‘Situation’ Report. This is just a semantic difference as to what’s a report and what’s a survey. But if Doug thinks that’s significant, OK. He can have that one.
What is significant is that Henwood thinks the CES (Current Employment Survey) is more important and accurate than the CPS (Current Population Survey). But the CES is not really a survey; it’s a partial census and thus a statistical population that gathers data from, as Henwood admits, 142,000 establishments. As a group the 142,000 send in their data to the government every month. But because, according to Henwood, the CES 142,000 compares to the CPS ‘only’ 60,000 monthly interviews of households (actually 110,000 individuals interviewed), he argues “the CES is much larger (than the CPS)…it’s far more accurate”.
But the CPS is not just a “household survey”; it is also a survey of employment conditions of millions of smaller businesses through the survey of worker households. In fact, it can be argued that, in surveying 110,000 individuals each month, and then rotating and adding more households throughout the year, (roughly doubling the number contacted) the CPS in fact reflects a much larger body of business hiring, layoffs, and thus total employment, than does the CES.
Henwood further argues that the CES 142,000 is more accurate because it is checked against the unemployment insurance system. But unemployment insurance has nothing to do with the numbers of employed or unemployed. And checking it is done to determine, among other things, if the 142,000 are not cheating the system by underpaying unemployment payroll taxes. Contrary to Henwood’s point referencing it, saying the CES is checked against unemployment insurance rolls adds nothing to the idea that the CES misses coverage—i.e. job creation or decline—for 9 million small and medium businesses.
Henwood is confused about the CES and CPS in another important way. There are more than 9 million businesses in the US economy. The 60,000/110,000 CPS survey is a statistically significant survey of employment in those 9 million. The comparison therefore should be 142,000 businesses vs. 9 million businesses. Henwood thus erroneously compares a population (CES 142,000) to a sample (60,000), when the comparison should be a business population (CES 142,000) to a business population (CPS 9 million businesses).
In short, it makes little sense to argue as Henwood does that 142,000 is more accurate than 9 million based on number of businesses compared. If it’s just a question of the size of total businesses addressed, the CPS makes more sense. But comparing size to size makes little sense as well. The two sources look at different things. My point is don’t defend one at the exclusion of the other. Look to both for a more comprehensive view of the condition of the labor market. And the CPS suggests perhaps the 263,000 jobs may not be all that accurate.
But Henwood would have readers believe the CES, with 142,000 businesses, and the 263,000 jobs created last month in that group, is all that matters. Forget the other roughly 9 million businesses where, as even most economists admit, most of the job creation in the US occurs (or does not). Like the business press and government politicians, to believe Henwood we should take the 263,000 as the final word of the state of the US job market and forget all the rest.
For years I’ve been arguing there is a problem with government job stats that rely on two different, often conflicting populations to determine employment/unemployment: the job gains (or losses) and unemployment rate should be calculated from the same survey, but aren’t. Instead we get jobs created by large businesses (CES) and unemployment from the 9 million population of all businesses. This problem leads to often conflicting data reported by the two sources, CES and CPS.
This problem gives us the 263,000 jobs created in the CES from a survey of larger businesses, while it gives us the 191,000 full time jobs decline in the CPS, and in the preceding month, an even larger 228,000 full time jobs decline, from the CPS survey of the 9 million businesses. Which is correct? How does Henwood choose to explain this? By simply claiming the reported 191,000 full time job loss in the CPS in April is just normal short term volatility—which, by the way, is the typical government excuse one hears whenever there’s a contradiction in the numbers.
Henwood further assumes the role of slavish apologist of government stats by defending the U-3 unemployment rate as the best and final word on the state of the US labor market. He does refer to the U-6 unemployment rate, but unquestionably accepts the government’s current (and chronic) low estimates for the U-6.
The U-6 picks up ‘involuntary part time’ employment. (U-4 and U-5 reflect what’s called ‘marginally attached’ and ‘discouraged’. These latter numbers too are grossly underestimated in the official stats). Henwood disputes my claim that the U-3 is essentially an estimate of ‘full time’ jobs and says “No, it refers to work of any kind, not just full-time”. But if that were true, why add on ‘part time’ as the U-6 category separately? If there were part time unemployed in the U-3 and part time in the U-6 there would be likely ‘double counting’ of part time unemployed. No, U-3 is mostly full time and excludes all involuntary part time. Either that or there is indeed double counting. Maybe he means the U-3 includes voluntary part time. Even if so, however, the overwhelming number of the 162.5 million in the labor force is still full time jobs.
But this does not in any way contradict the anomaly of the CES reporting April’s 263,000 (mostly full time) jobs gain, while the CPS reports 191,000 (and 228,000 in March) full time jobs declines. And if the CPS reports 155,000 part time job creation, should it not mean that only 108,000 full time jobs were created in the CES report? How do you square the 108,000 full time jobs created in the CES with the 191,000 full time jobs lost in the CPS, Doug? What’s your explanation?
And if you say this contradiction is just a short term statistical volatility problem, how then do we know if the 263,000 is also not just a short term inaccurate statistically volatile (and inaccurate) number?
Given the CPS number showing full time job decline (191,000), and the otherwise CPS rise in part time jobs last month (155,000), in my prior article I suspected that there are more workers taking on second and third jobs. Henwood pooh poohs this and trusts the government numbers on ‘multiple job holders’ showing little change. Once again, trust the government numbers!
Official government stats show multiple job holders as of December 2018 at 7.7 million. Comparing that to December 2006, the last full year before the great recession,the number was 7.9 million. Does anyone out there really believe this number? That folks working part time second and third jobs has actually declined, given all the low paid service jobs, part time work, temp work, Uber, Taskrabbit, gig economy jobs created since the great recession, now accelerating? Doug does. Government bureaucrats can do no wrong and always report the facts.
Henwood provides charts that show that Temp jobs (almost always part time) have not been changing for at least the past two decades. As he says, temp jobs have been steady as a percent of the total work force for the past two decades, peaking at 2% of total jobs. “It’s barely changed for five years.” Sure, Doug. No one’s been hiring attempts except through agencies. That’s all the government data you slavishly offer as a rebuttle show. If you were more ‘skilled and knowledgeable’ (an insult you direct to me) you would know the Labor Dept. data you cite refers only to Temp Agency hiring. I suggest you try talking to your local auto worker and ask him how many temps have been hired since 2009. It’s about at least a third of the auto work force today. It’s the same throughout manufacturing, and other sectors as well. But trust the government stats, Doug. They’re always right and never misleading or wrong.
The Labor Dept. has been covering up the growth of temp jobs since the 1990s. It produced three one-off reports, then George Bush stopped it. Too volatile. (There’s that word). Henwood says “It’s nowhere big a deal as Rasmus would have you believe”. The basis for his comment is, of course, you guessed it: the government’s data and reports.
How the government purposely underestimates labor stats that are embarrassing to it was clearly revealed, yet again, last year in its report on ‘precarious jobs’ (meaning temp, part time, gig, otherwise contingent, etc.). I and others have dissected that official report which claimed the gig economy was insignificant. But it turned out what the report defined as ‘gig’ was only full time uber/lyft drivers. Drivers as second and third jobbers were left out. There are many ways to lie. One is to simply redefine it away. Another to quietly omit data and facts. Another to insert false data and facts. Another to change the causal relation between facts and propositions. And more.
As far as my suggestion that the April jobs numbers may reflect hiring of census workers, it is true the government to date has not indicated how many hired. I simply suggested it may explain some of the 155,000 part time job gains in the CPS report. My suggestion was based on past practice by the government during census years. By April 2009 the government had hired 154,000 for census work. By April 1999, it had hired 181,000. If the hiring is really negligible to date in government reports, either Trump is not planning to do the census properly (another of his violations of the US Constitution), or the hiring is in fact underway but not yet reported, or, if not, excess hiring will soon have to occur. Trump likely wants to create chaos in the census, which suits his political purposes. Again, my point here was only a suggestion that census workers were part of the hiring, not a claim they were.
Henwood does give a backhanded concession to me that maybe my point of the 646,000 ‘Not in the Labor Force’ reported number indicates something is going on with the government data underestimating the total actually unemployed by having left the labor force in recent years. But he just can’t let himself admit it. It would not be in keeping with his personalized attack style or nasty comments that pepper his critique.
My point concerning the ‘Not in the Labor Force’ numbers (646,000 rise last month) is that it likely corroborates that more workers are long term dropping out of the labor force because they can’t find decent full time jobs and the part time jobs pay less and less in real terms (requiring taking on second and third jobs?). Once again, he gives a backhanded comment that a point is made but says ‘the bigger point eludes me’(Rasmus).
Really? I’ve only been writing about the collapsing labor force participation rate and how it’s not being properly picked up in jobs numbers since 2005 and especially since 2013. A drop in the labor force participation rate from 67.3% of the total labor force in December 2000 to the latest participation rate of 62.8% represents more than 7 million workers either leaving or not entering the labor force. And if they’re not counted in the labor force, that reduces unemployment rates.
They should be added to the ‘unemployment’ rolls. They’re not working. The labor force today should be 170 million not 162.5 million. Maybe they’re not working because they can’t afford to live on the part time, temp, contingent jobs that have been steadily replacing full time jobs that have been stagnant or declining, while part time/temp/gig has been accelerating? But given his commitment to government stats, Henwood could never agree to that interpretation, could he?
Here’s another difference on the veracity of government labor stats he and I have. In 2006 the labor force was approximately 152 million. It has grown by roughly 10 million–not including the dropping out of 7.3 million represented by the falling labor force participation rate. Henwood accepts as accurate the Labor Dept’s estimate of discouraged workers (U-5) as accurate. In November 2007 just prior to the great recession the discouraged workers category represented only .2 of 1% of the labor force. Given the 10 million increase in the labor force since then, it is today still .2 of 1%. Can it be true that the percentage of discouraged workers has not risen at all in the intervening years–given the impact of the great recession, lagging economic recovery for years, and the fact of 7 million have dropped out of the labor force? It makes no sense that there should not be a corresponding increase in the percent of discouraged workers given the changed conditions of the last decade. The government data must be underestimating the discouraged worker category of unemployed (defined as out of work but having given up looking for the past year).
Yet Henwood once again sees no problem here at all with this category of U-4, discouraged worker unemployment. All he can do is defend his buddies at the Labor Dept. and agree with their stats. Accept all their assumptions, definitions, and methodologies as absolutely correct. Reproduce all their graphs based on those definitions, assumptions and methodologies. And then use them as evidence to attack my alternative interpretations of the data.
Doug, you should spend less time performing his task of defender of government data and stats that Americans know increasingly contradict the reality they face.
You can show all the graphs you want. But they’re graphs based on data (and the definitions, assumptions and methods behind the data) that are sometimes erroneous. And while not all government data is incorrect or inaccurate, to slavishly defend it as you do is a gross disservice to the truth. You defend your positions by employing the very government data that I am arguing is not always truthful. It may be factual, but facts are selective and not necessarily truthful.
You can attack me personally all you like, Doug, but your attack shows one irrefutable conclusion: You believe unconditionally in the government’s data instead of challenging it when called for. In that regard you are an apologist and, when it comes to government data, you are clearly in the camp of the bureaucrats and other government conscious mis-representers of the truth. Misrepresentation by clever statistical manipulation, by omission of facts and alternative interpretations, and by obfuscation based on methodologies that are intended to conceal rather than reveal—-all of which you defend.
You help them maintain the fiction that the economy is doing great, that jobs are plentiful and well-paid, and we’re all better off than we think. That makes you an ideologist, not an economist. I think you’d be great writing editorials for the Wall St. Journal. Given your style and content, you really have more in common with those guys. I’ll write them on your behalf and see if they’re interested.
Jack Rasmus
May 7, 2019
Jack is author of the forthcoming book, ‘The Scourge of Neoliberalism: US Policy from Reagan to Trump’, Clarity Press, September 2019. He blogs at jackrasmus.com, hosts the weekly radio show, Alternative Visions on the Progressive Radio network, and tweets at @drjackrasmus.
“Let’s see Doug if you’re willing to post my reply and let your readers see the other side of the debate, as follows.”
Jack, this post is a response to what you posted as a comment here. It’s linked to in the first sentence.