Unions lose some more
Here are the headlines for my last five writeups of the Bureau of Labor Statistics’ annual accounting of union density:
Union density: yet another low (2020)
Pandemic boosts union density (2021)
Union membership resumes its fall (2022)
Union density keeps falling (2023)
Unions had a flat 2023 (2024).
It’s not hard to detect a theme here: near-relentless decline. The only recent up year was 2021, which came about because more nonunion workers lost their jobs than union workers during the worst months of the pandemic, raising the density numbers. (Density is the share of the labor force that’s in a union.) Since 2019 (the subject of the 2020 report), it’s fallen from 10.4% to 9.9%. The long-term trajectory, graphed below, is almost unrelievedly downward. Private-sector density peaked in 1953, after rising sharply through the 1930s and 1940s, and has essentially collapsed. Public sector unions grew enormously from the early 1970s into the early 1990s, but after peaking in 1993, their density been heading down too, thanks to the state-level right-wing war on unions.
Since 1965, union density has risen only five times from one year to the next; it’s fallen in 49. Although one has to take stats from over a century ago skeptically, it looks like the private sector union share today is lower than it was in 1900. The public sector is back to 1977 levels.

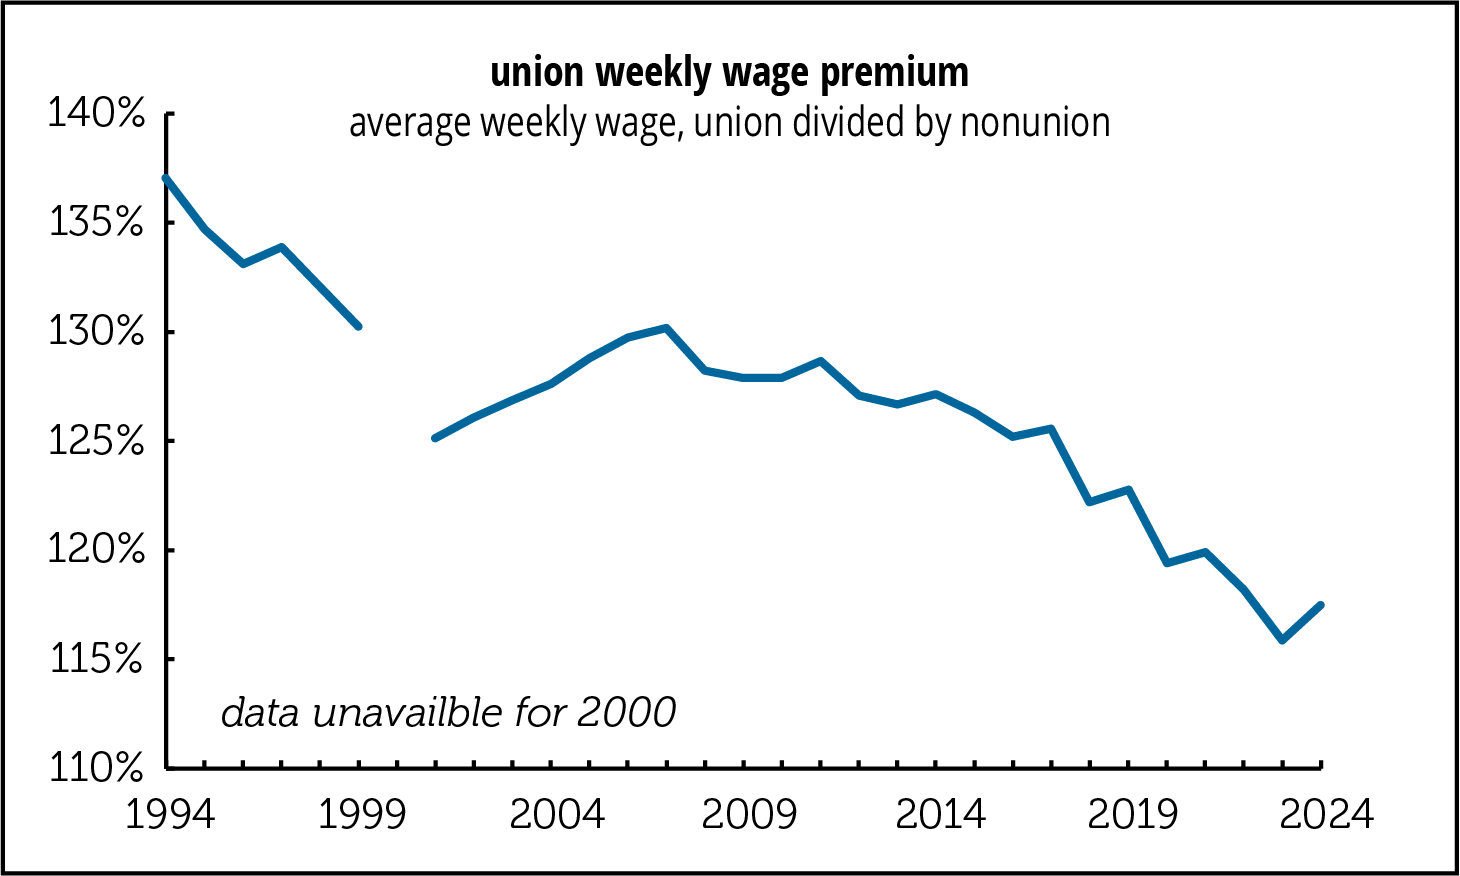
A reminder why unions are important: the raise wages. The so-called union premium, the amount by which a union wage exceeds a nonunion wage, has been declining, but it was still 17% last year (graph below). Barry Hirsch and David Macpherson (see link below) adjust the premium for variation in industry, occupation, and demographics to isolate a pure union effect. Their data for 2024 isn’t out yet, but the adjustment does take a chunk out of the union premium, lowering it by about a third. But the premium is still a nontrivial 12% over the last five years.
More to come tomorrow on the union premium by demographic and union density by state.
A taste of the geographical story: union density in the states of the former Confederacy averaged 4.3% last year. It averaged 10.9% for the states that did not secede—well over twice as much. The planters came up with a durable labor market model.
Note on sources: The public sector data for 1973–1999 comes from Barry Hirsch and David Macpherson. Private sector data for 1900–1964 comes from Leo Troy and David Sheflin’s Union Sourcebook. Later data is from the BLS.

